|
Download Data (XLS File) |
|
||||||||
|
||||||||
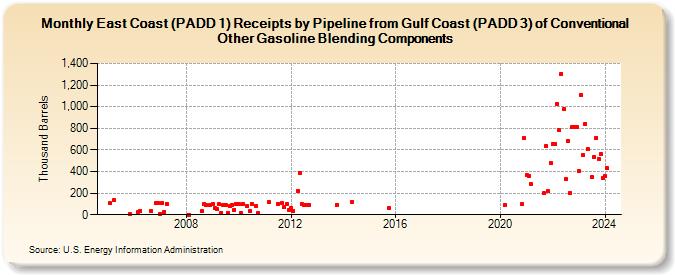
| East Coast (PADD 1) Receipts by Pipeline from Gulf Coast (PADD 3) of Conventional Other Gasoline Blending Components (Thousand Barrels) | ||||||||
| Year | Jan | Feb | Mar | Apr | May | Jun | Jul | Aug | Sep | Oct | Nov | Dec |
|---|---|---|---|---|---|---|---|---|---|---|---|---|
| 2005 | 105 | 134 | 5 | |||||||||
| 2006 | 29 | 36 | 32 | 106 | 113 | |||||||
| 2007 | 9 | 107 | 24 | 99 | ||||||||
| 2008 | 1 | 30 | 96 | 87 | 92 | |||||||
| 2009 | 101 | 63 | 51 | 96 | 19 | 89 | 86 | 16 | 79 | 93 | 45 | 101 |
| 2010 | 97 | 13 | 97 | 80 | 31 | 103 | 83 | 17 | ||||
| 2011 | 114 | 102 | 105 | 67 | 97 | 47 | ||||||
| 2012 | 66 | 38 | 220 | 382 | 97 | 92 | 92 | 93 | ||||
| 2013 | 94 | |||||||||||
| 2014 | 122 | |||||||||||
| 2015 | 62 | |||||||||||
| 2020 | 89 | 96 | 710 | |||||||||
| 2021 | 364 | 362 | 282 | 198 | 635 | 215 | 479 | |||||
| 2022 | 655 | 655 | 1,029 | 783 | 1,306 | 980 | 329 | 686 | 200 | 816 | 816 | 816 |
| 2023 | 404 | 1,112 | 552 | 844 | 606 | 351 | 533 | 713 | 514 | 563 | 340 | |
| 2024 | 354 | 428 | 767 | 432 | 542 | 521 | ||||||
| - = No Data Reported; -- = Not Applicable; NA = Not Available; W = Withheld to avoid disclosure of individual company data. |
| Release Date: 8/30/2024 |
| Next Release Date: 9/30/2024 |