|
Download Data (XLS File) |
|
||||||||
|
||||||||
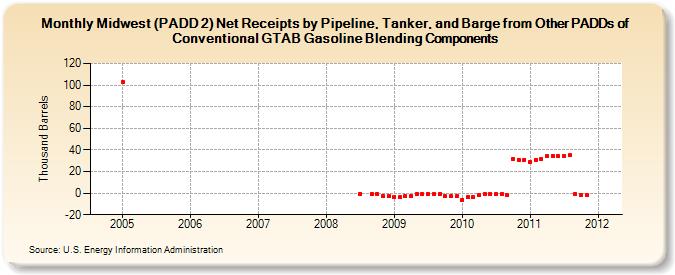
| Midwest (PADD 2) Net Receipts by Pipeline, Tanker, and Barge from Other PADDs of Conventional GTAB Gasoline Blending Components (Thousand Barrels) | ||||||||
| Year | Jan | Feb | Mar | Apr | May | Jun | Jul | Aug | Sep | Oct | Nov | Dec |
|---|---|---|---|---|---|---|---|---|---|---|---|---|
| 2005 | 103 | |||||||||||
| 2008 | -1 | -1 | -1 | -3 | -3 | |||||||
| 2009 | -4 | -4 | -3 | -3 | -1 | -1 | -1 | -1 | -1 | -3 | -3 | -3 |
| 2010 | -6 | -4 | -4 | -2 | -1 | -1 | -1 | -1 | -2 | 32 | 31 | 31 |
| 2011 | 29 | 31 | 32 | 34 | 34 | 34 | 34 | 35 | -1 | -2 | -2 | |
| - = No Data Reported; -- = Not Applicable; NA = Not Available; W = Withheld to avoid disclosure of individual company data. |
| Release Date: 8/30/2024 |
| Next Release Date: 9/30/2024 |
Referring Pages: