|
Download Data (XLS File) |
|
||||||||
|
||||||||
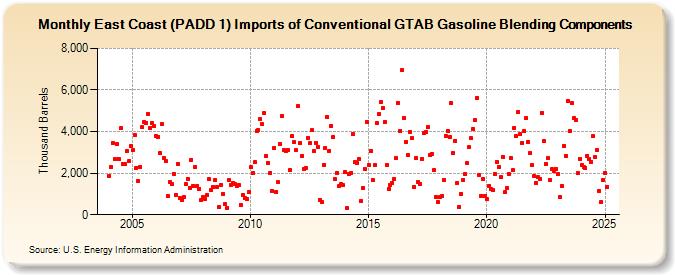
| East Coast (PADD 1) Imports of Conventional GTAB Gasoline Blending Components (Thousand Barrels) | ||||||||
| Year | Jan | Feb | Mar | Apr | May | Jun | Jul | Aug | Sep | Oct | Nov | Dec |
|---|---|---|---|---|---|---|---|---|---|---|---|---|
| 2004 | 1,869 | 2,312 | 3,451 | 2,676 | 3,386 | 2,698 | 4,147 | 2,447 | 2,443 | 3,041 | 2,564 | 3,300 |
| 2005 | 3,100 | 3,811 | 2,265 | 1,622 | 2,309 | 4,208 | 4,460 | 4,428 | 4,842 | 4,181 | 4,401 | 4,263 |
| 2006 | 3,797 | 3,759 | 2,962 | 4,351 | 2,707 | 2,574 | 897 | 1,578 | 1,473 | 1,980 | 965 | 2,459 |
| 2007 | 814 | 710 | 837 | 1,456 | 1,734 | 1,298 | 2,653 | 1,383 | 2,302 | 1,371 | 1,249 | 687 |
| 2008 | 872 | 758 | 940 | 1,705 | 1,166 | 1,334 | 1,666 | 1,336 | 365 | 1,442 | 1,011 | 515 |
| 2009 | 336 | 1,657 | 1,445 | 1,543 | 1,476 | 1,386 | 1,436 | 490 | 963 | 810 | 748 | 1,082 |
| 2010 | 2,279 | 2,014 | 2,516 | 4,034 | 4,070 | 4,604 | 4,342 | 4,889 | 2,826 | 2,502 | 2,027 | 1,159 |
| 2011 | 3,205 | 1,101 | 1,557 | 3,388 | 4,741 | 3,111 | 3,041 | 3,097 | 2,145 | 3,785 | 3,492 | 3,091 |
| 2012 | 5,223 | 3,445 | 2,848 | 2,221 | 2,252 | 3,697 | 3,431 | 4,072 | 3,041 | 3,467 | 3,270 | 730 |
| 2013 | 613 | 2,410 | 3,207 | 4,693 | 3,087 | 4,287 | 3,719 | 1,703 | 2,024 | 1,382 | 1,463 | 1,420 |
| 2014 | 2,053 | 299 | 1,974 | 2,020 | 3,876 | 2,526 | 2,476 | 2,684 | 668 | 1,299 | 2,191 | 4,460 |
| 2015 | 2,389 | 3,059 | 1,693 | 2,371 | 4,392 | 4,832 | 5,398 | 5,129 | 4,483 | 2,397 | 1,228 | 1,440 |
| 2016 | 1,526 | 1,717 | 2,709 | 5,374 | 4,048 | 6,960 | 4,668 | 3,518 | 2,854 | 3,998 | 3,670 | 1,346 |
| 2017 | 2,730 | 1,575 | 1,495 | 2,683 | 3,910 | 3,980 | 4,208 | 2,872 | 2,934 | 2,135 | 867 | 605 |
| 2018 | 833 | 878 | 1,672 | 3,808 | 4,050 | 3,731 | 5,373 | 2,952 | 3,564 | 1,524 | 381 | 1,015 |
| 2019 | 1,693 | 1,949 | 2,477 | 3,246 | 3,675 | 4,134 | 4,535 | 5,615 | 1,912 | 914 | 1,709 | 923 |
| 2020 | 735 | 1,393 | 1,259 | 1,175 | 1,971 | 2,550 | 2,297 | 1,808 | 2,798 | 1,075 | 1,285 | 1,973 |
| 2021 | 2,730 | 2,130 | 4,184 | 3,769 | 4,946 | 3,894 | 3,469 | 4,032 | 4,641 | 3,519 | 2,971 | 2,383 |
| 2022 | 1,864 | 1,535 | 1,809 | 1,738 | 4,908 | 3,539 | 2,456 | 2,710 | 1,653 | 2,180 | 2,092 | 2,209 |
| 2023 | 1,968 | 847 | 1,403 | 3,324 | 2,838 | 5,483 | 4,023 | 5,363 | 4,632 | 4,566 | 2,002 | 2,695 |
| 2024 | 2,388 | |||||||||||
| - = No Data Reported; -- = Not Applicable; NA = Not Available; W = Withheld to avoid disclosure of individual company data. |
| Release Date: 3/29/2024 |
| Next Release Date: 4/30/2024 |