|
Download Data (XLS File) |
|
||||||||
|
||||||||
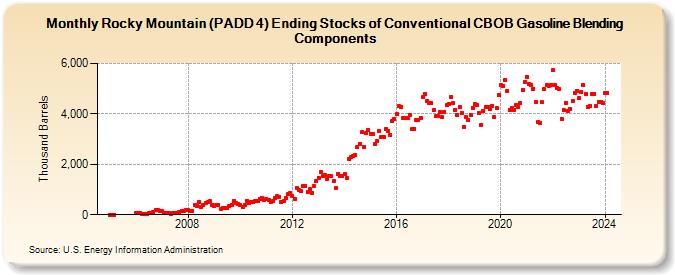
| Rocky Mountain (PADD 4) Ending Stocks of Conventional CBOB Gasoline Blending Components (Thousand Barrels) | ||||||||
| Year | Jan | Feb | Mar | Apr | May | Jun | Jul | Aug | Sep | Oct | Nov | Dec |
|---|---|---|---|---|---|---|---|---|---|---|---|---|
| 2005 | 7 | 7 | 6 | |||||||||
| 2006 | 54 | 50 | 60 | 45 | 22 | 39 | 70 | 67 | 102 | 188 | 196 | 130 |
| 2007 | 129 | 87 | 55 | 82 | 43 | 81 | 76 | 60 | 120 | 158 | 155 | 202 |
| 2008 | 173 | 150 | 145 | 394 | 361 | 519 | 318 | 375 | 448 | 486 | 532 | 391 |
| 2009 | 333 | 377 | 390 | 237 | 261 | 249 | 283 | 334 | 399 | 560 | 470 | 432 |
| 2010 | 384 | 294 | 381 | 557 | 451 | 524 | 508 | 554 | 563 | 643 | 667 | 595 |
| 2011 | 625 | 588 | 505 | 538 | 655 | 724 | 696 | 499 | 555 | 648 | 820 | 859 |
| 2012 | 724 | 626 | 1,062 | 976 | 922 | 1,149 | 1,132 | 905 | 1,004 | 874 | 1,138 | 1,338 |
| 2013 | 1,473 | 1,676 | 1,551 | 1,586 | 1,406 | 1,531 | 1,527 | 1,322 | 1,044 | 1,633 | 1,519 | 1,540 |
| 2014 | 1,606 | 1,463 | 2,222 | 2,271 | 2,342 | 2,364 | 2,674 | 2,820 | 3,263 | 2,693 | 3,261 | 3,370 |
| 2015 | 3,218 | 3,219 | 2,821 | 2,924 | 3,335 | 3,095 | 3,069 | 3,384 | 3,330 | 3,161 | 3,735 | 3,813 |
| 2016 | 3,989 | 4,311 | 4,289 | 3,823 | 3,835 | 3,846 | 3,967 | 3,386 | 3,416 | 3,753 | 3,771 | 3,847 |
| 2017 | 4,668 | 4,797 | 4,520 | 4,414 | 4,437 | 4,147 | 3,901 | 3,908 | 4,087 | 3,865 | 4,078 | 4,339 |
| 2018 | 4,393 | 4,676 | 4,420 | 4,152 | 3,938 | 4,264 | 4,049 | 3,493 | 3,884 | 3,762 | 3,967 | 4,247 |
| 2019 | 4,380 | 4,339 | 4,052 | 3,579 | 4,115 | 4,259 | 4,288 | 4,186 | 4,328 | 3,870 | 4,217 | 4,747 |
| 2020 | 5,142 | 5,126 | 5,342 | 4,921 | 4,161 | 4,232 | 4,164 | 4,346 | 4,282 | 4,424 | 4,948 | 5,257 |
| 2021 | 5,468 | 5,201 | 5,148 | 5,003 | 4,477 | 3,674 | 3,653 | 4,453 | 4,986 | 5,149 | 5,098 | 5,157 |
| 2022 | 5,727 | 5,128 | 5,027 | 4,979 | 3,810 | 4,152 | 4,438 | 4,118 | 4,192 | 4,521 | 4,840 | 4,921 |
| 2023 | 4,618 | 4,854 | 5,127 | 4,783 | 4,292 | 4,324 | 4,771 | 4,799 | 4,308 | 4,470 | 4,454 | 4,423 |
| 2024 | 4,816 | |||||||||||
| - = No Data Reported; -- = Not Applicable; NA = Not Available; W = Withheld to avoid disclosure of individual company data. |
| Release Date: 3/29/2024 |
| Next Release Date: 4/30/2024 |