|
Download Data (XLS File) |
|
||||||||
|
||||||||
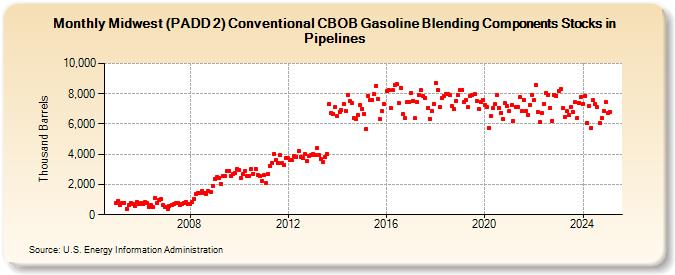
| Midwest (PADD 2) Conventional CBOB Gasoline Blending Components Stocks in Pipelines (Thousand Barrels) | ||||||||
| Year | Jan | Feb | Mar | Apr | May | Jun | Jul | Aug | Sep | Oct | Nov | Dec |
|---|---|---|---|---|---|---|---|---|---|---|---|---|
| 2005 | 768 | 908 | 663 | 784 | 793 | 398 | 622 | 806 | 686 | 576 | 838 | 722 |
| 2006 | 804 | 719 | 833 | 754 | 541 | 615 | 490 | 1,116 | 765 | 971 | 1,028 | 656 |
| 2007 | 480 | 378 | 565 | 658 | 699 | 745 | 777 | 633 | 738 | 770 | 868 | 724 |
| 2008 | 692 | 867 | 1,071 | 1,372 | 1,446 | 1,451 | 1,552 | 1,459 | 1,371 | 1,572 | 1,515 | 1,930 |
| 2009 | 2,332 | 2,488 | 2,421 | 2,064 | 2,551 | 2,541 | 2,876 | 2,894 | 2,541 | 2,710 | 2,752 | 3,028 |
| 2010 | 2,964 | 2,406 | 2,687 | 2,862 | 2,564 | 2,564 | 3,001 | 2,717 | 3,046 | 2,638 | 2,571 | 2,241 |
| 2011 | 2,599 | 2,091 | 2,695 | 3,252 | 3,416 | 4,009 | 3,631 | 3,391 | 3,924 | 3,387 | 3,287 | 3,780 |
| 2012 | 3,732 | 3,607 | 3,613 | 3,875 | 3,845 | 4,204 | 3,842 | 3,723 | 3,997 | 3,565 | 3,865 | 3,942 |
| 2013 | 4,028 | 3,959 | 4,409 | 3,942 | 3,693 | 3,485 | 3,833 | 4,012 | 7,314 | 6,744 | 6,674 | 7,092 |
| 2014 | 6,499 | 6,823 | 6,937 | 7,321 | 6,889 | 7,938 | 7,514 | 7,396 | 6,410 | 6,316 | 6,570 | 7,230 |
| 2015 | 7,016 | 6,645 | 5,692 | 7,836 | 7,555 | 7,603 | 7,950 | 8,543 | 7,640 | 6,296 | 6,837 | 7,312 |
| 2016 | 8,156 | 8,253 | 7,070 | 8,226 | 8,572 | 8,611 | 7,415 | 8,411 | 6,635 | 6,386 | 7,429 | 7,471 |
| 2017 | 8,064 | 7,548 | 6,367 | 7,476 | 7,885 | 8,218 | 7,829 | 7,702 | 7,087 | 6,360 | 6,836 | 7,332 |
| 2018 | 8,724 | 8,242 | 7,091 | 7,729 | 7,847 | 7,960 | 8,008 | 7,893 | 7,166 | 6,958 | 7,534 | 7,931 |
| 2019 | 8,253 | 8,260 | 7,475 | 7,565 | 7,092 | 7,869 | 7,887 | 7,978 | 7,512 | 6,984 | 7,452 | 7,605 |
| 2020 | 7,281 | 7,110 | 5,759 | 6,526 | 7,025 | 7,299 | 7,945 | 7,053 | 6,736 | 6,297 | 7,369 | 7,159 |
| 2021 | 6,858 | 7,239 | 6,210 | 7,138 | 7,096 | 7,756 | 6,825 | 7,597 | 6,877 | 6,594 | 7,261 | 7,914 |
| 2022 | 7,569 | 8,557 | 6,778 | 6,106 | 6,740 | 7,321 | 8,069 | 7,932 | 7,082 | 6,218 | 7,918 | 7,870 |
| 2023 | 7,849 | 7,998 | 6,732 | 6,226 | 6,725 | 6,915 | 7,392 | 7,091 | 7,759 | 6,176 | 7,278 | 7,496 |
| 2024 | 7,329 | |||||||||||
| - = No Data Reported; -- = Not Applicable; NA = Not Available; W = Withheld to avoid disclosure of individual company data. |
| Release Date: 3/29/2024 |
| Next Release Date: 4/30/2024 |