|
Download Data (XLS File) |
|
||||||||
|
||||||||
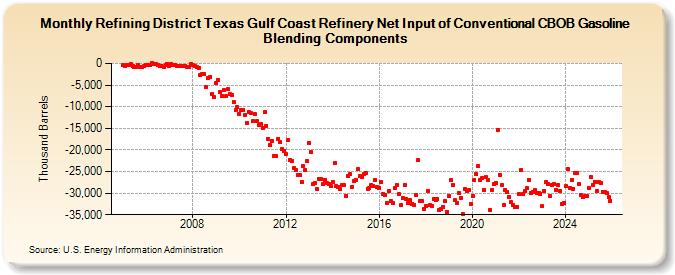
| Refining District Texas Gulf Coast Refinery Net Input of Conventional CBOB Gasoline Blending Components (Thousand Barrels) | ||||||||
| Year | Jan | Feb | Mar | Apr | May | Jun | Jul | Aug | Sep | Oct | Nov | Dec |
|---|---|---|---|---|---|---|---|---|---|---|---|---|
| 2005 | -439 | -571 | -341 | -408 | -162 | -576 | -701 | -715 | -427 | -729 | -831 | -679 |
| 2006 | -456 | -427 | -422 | -3 | -208 | -150 | -421 | -608 | -683 | -722 | -465 | -96 |
| 2007 | -694 | -132 | -426 | -319 | -577 | -542 | -511 | -526 | -504 | -775 | -730 | -210 |
| 2008 | -323 | -522 | -768 | -1,001 | -2,771 | -2,395 | -2,391 | -5,467 | -3,427 | -3,178 | -7,046 | -7,823 |
| 2009 | -4,516 | -3,709 | -6,644 | -7,448 | -6,216 | -7,599 | -5,967 | -7,127 | -7,191 | -8,942 | -10,770 | -10,178 |
| 2010 | -11,647 | -10,808 | -10,729 | -11,856 | -13,820 | -11,315 | -11,558 | -13,374 | -11,705 | -13,383 | -14,333 | -14,035 |
| 2011 | -14,920 | -11,281 | -14,378 | -17,446 | -18,868 | -17,960 | -21,361 | -21,434 | -17,394 | -18,117 | -19,677 | -20,284 |
| 2012 | -21,043 | -17,725 | -22,279 | -22,492 | -24,179 | -24,686 | -25,916 | -25,806 | -27,443 | -23,735 | -24,636 | -22,606 |
| 2013 | -18,321 | -20,437 | -27,997 | -27,590 | -29,022 | -26,650 | -26,702 | -27,927 | -26,858 | -27,686 | -27,971 | -28,373 |
| 2014 | -27,348 | -23,139 | -28,376 | -28,600 | -29,002 | -28,162 | -28,079 | -30,556 | -26,071 | -25,637 | -28,500 | -27,240 |
| 2015 | -27,079 | -24,501 | -26,123 | -26,220 | -25,652 | -25,306 | -29,031 | -28,878 | -28,080 | -28,452 | -26,930 | -28,654 |
| 2016 | -28,717 | -27,490 | -30,200 | -30,410 | -32,187 | -29,556 | -31,895 | -32,245 | -28,714 | -28,165 | -30,227 | -32,817 |
| 2017 | -31,075 | -28,170 | -31,293 | -32,325 | -31,565 | -32,480 | -32,662 | -30,448 | -22,420 | -31,897 | -31,784 | -33,610 |
| 2018 | -32,997 | -29,482 | -32,836 | -32,884 | -31,358 | -31,682 | -31,434 | -34,013 | -33,626 | -33,151 | -31,892 | -34,266 |
| 2019 | -30,658 | -26,919 | -28,236 | -31,709 | -32,226 | -29,935 | -31,039 | -34,789 | -29,113 | -29,513 | -29,384 | -32,570 |
| 2020 | -30,697 | -27,024 | -25,688 | -23,809 | -26,943 | -26,496 | -29,307 | -26,309 | -27,029 | -33,840 | -29,195 | -27,903 |
| 2021 | -27,677 | -15,359 | -25,724 | -28,104 | -32,666 | -29,297 | -29,771 | -30,799 | -32,151 | -32,840 | -33,153 | -33,171 |
| 2022 | -30,279 | -24,545 | -30,252 | -29,538 | -28,881 | -26,936 | -29,944 | -29,720 | -29,269 | -29,912 | -30,001 | -30,135 |
| 2023 | -33,088 | -29,424 | -27,365 | -27,838 | -30,680 | -28,118 | -27,900 | -29,179 | -28,091 | -29,501 | -32,429 | -32,193 |
| 2024 | -28,408 | |||||||||||
| - = No Data Reported; -- = Not Applicable; NA = Not Available; W = Withheld to avoid disclosure of individual company data. |
| Release Date: 3/29/2024 |
| Next Release Date: 4/30/2024 |