|
Download Data (XLS File) |
|
||||||||
|
||||||||
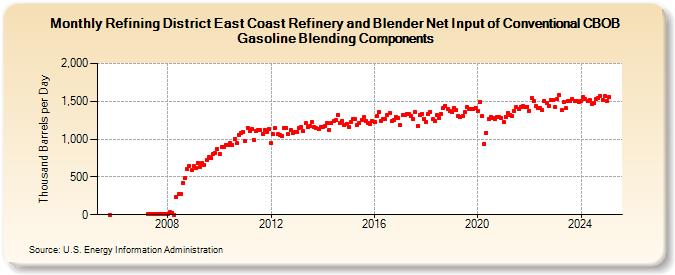
| Refining District East Coast Refinery and Blender Net Input of Conventional CBOB Gasoline Blending Components (Thousand Barrels per Day) | ||||||||
| Year | Jan | Feb | Mar | Apr | May | Jun | Jul | Aug | Sep | Oct | Nov | Dec |
|---|---|---|---|---|---|---|---|---|---|---|---|---|
| 2005 | 2 | |||||||||||
| 2007 | 13 | 15 | 15 | 15 | 16 | 15 | 16 | 15 | 15 | |||
| 2008 | 14 | 30 | 26 | 0 | 238 | 272 | 275 | 422 | 480 | 605 | 645 | 588 |
| 2009 | 640 | 622 | 688 | 637 | 681 | 664 | 722 | 762 | 745 | 805 | 816 | 865 |
| 2010 | 809 | 896 | 899 | 916 | 920 | 948 | 921 | 1,002 | 943 | 1,058 | 1,083 | 1,097 |
| 2011 | 979 | 1,151 | 1,112 | 1,127 | 992 | 1,112 | 1,119 | 1,122 | 1,073 | 1,119 | 1,095 | 1,128 |
| 2012 | 944 | 1,064 | 1,145 | 1,065 | 1,057 | 1,044 | 1,151 | 1,144 | 1,067 | 1,125 | 1,081 | 1,100 |
| 2013 | 1,099 | 1,149 | 1,161 | 1,101 | 1,208 | 1,156 | 1,174 | 1,224 | 1,162 | 1,141 | 1,132 | 1,159 |
| 2014 | 1,158 | 1,169 | 1,216 | 1,121 | 1,212 | 1,237 | 1,249 | 1,317 | 1,216 | 1,245 | 1,184 | 1,203 |
| 2015 | 1,165 | 1,231 | 1,268 | 1,261 | 1,188 | 1,218 | 1,254 | 1,287 | 1,239 | 1,218 | 1,194 | 1,239 |
| 2016 | 1,228 | 1,303 | 1,354 | 1,237 | 1,272 | 1,262 | 1,321 | 1,344 | 1,239 | 1,255 | 1,290 | 1,279 |
| 2017 | 1,188 | 1,317 | 1,317 | 1,329 | 1,337 | 1,311 | 1,267 | 1,357 | 1,172 | 1,316 | 1,333 | 1,271 |
| 2018 | 1,229 | 1,330 | 1,362 | 1,262 | 1,240 | 1,313 | 1,278 | 1,337 | 1,410 | 1,441 | 1,397 | 1,369 |
| 2019 | 1,353 | 1,416 | 1,381 | 1,312 | 1,296 | 1,307 | 1,352 | 1,421 | 1,393 | 1,398 | 1,397 | 1,412 |
| 2020 | 1,368 | 1,491 | 1,301 | 940 | 1,082 | 1,268 | 1,296 | 1,284 | 1,269 | 1,290 | 1,293 | 1,283 |
| 2021 | 1,227 | 1,296 | 1,349 | 1,317 | 1,300 | 1,374 | 1,424 | 1,402 | 1,425 | 1,433 | 1,427 | 1,429 |
| 2022 | 1,377 | 1,545 | 1,499 | 1,432 | 1,409 | 1,408 | 1,379 | 1,506 | 1,482 | 1,437 | 1,511 | 1,514 |
| 2023 | 1,428 | 1,525 | 1,576 | 1,377 | 1,485 | 1,407 | 1,499 | 1,503 | 1,529 | 1,509 | 1,508 | 1,484 |
| 2024 | 1,507 | 1,558 | 1,527 | 1,504 | ||||||||
| - = No Data Reported; -- = Not Applicable; NA = Not Available; W = Withheld to avoid disclosure of individual company data. |
| Release Date: 6/28/2024 |
| Next Release Date: 7/31/2024 |