|
Download Data (XLS File) |
|
||||||||
|
||||||||
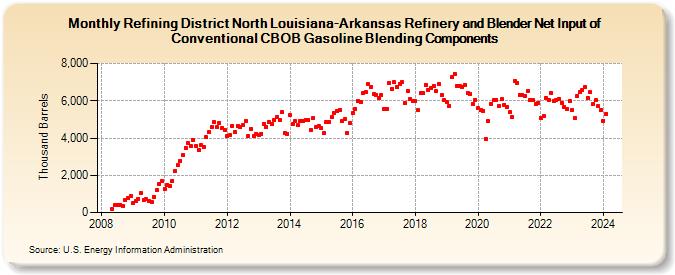
| Refining District North Louisiana-Arkansas Refinery and Blender Net Input of Conventional CBOB Gasoline Blending Components (Thousand Barrels) | ||||||||
| Year | Jan | Feb | Mar | Apr | May | Jun | Jul | Aug | Sep | Oct | Nov | Dec |
|---|---|---|---|---|---|---|---|---|---|---|---|---|
| 2008 | 178 | 399 | 429 | 418 | 370 | 653 | 789 | 879 | ||||
| 2009 | 520 | 618 | 750 | 1,031 | 676 | 707 | 619 | 593 | 854 | 1,196 | 1,529 | 1,700 |
| 2010 | 1,272 | 1,498 | 1,440 | 1,710 | 2,214 | 2,538 | 2,783 | 3,088 | 3,479 | 3,722 | 3,553 | 3,903 |
| 2011 | 3,579 | 3,365 | 3,600 | 3,519 | 4,036 | 4,297 | 4,576 | 4,850 | 4,593 | 4,813 | 4,553 | 4,453 |
| 2012 | 4,097 | 4,168 | 4,647 | 4,305 | 4,655 | 4,577 | 4,700 | 4,915 | 4,115 | 4,498 | 4,098 | 4,234 |
| 2013 | 4,158 | 4,234 | 4,766 | 4,573 | 4,881 | 4,748 | 4,992 | 5,118 | 4,981 | 5,384 | 4,272 | 4,205 |
| 2014 | 5,221 | 4,772 | 4,905 | 4,694 | 4,931 | 4,903 | 4,991 | 4,964 | 4,428 | 5,082 | 4,616 | 4,647 |
| 2015 | 4,526 | 4,251 | 4,873 | 4,847 | 5,130 | 5,362 | 5,440 | 5,518 | 4,913 | 5,016 | 4,259 | 4,805 |
| 2016 | 5,354 | 5,553 | 5,969 | 5,918 | 6,400 | 6,444 | 6,889 | 6,764 | 6,352 | 6,335 | 6,166 | 6,316 |
| 2017 | 5,583 | 5,572 | 6,972 | 6,650 | 6,989 | 6,736 | 6,914 | 7,003 | 5,869 | 6,524 | 6,113 | 5,983 |
| 2018 | 5,977 | 5,488 | 6,391 | 6,393 | 6,870 | 6,561 | 6,685 | 6,812 | 6,506 | 6,892 | 6,305 | 6,061 |
| 2019 | 5,907 | 5,736 | 7,256 | 7,440 | 6,807 | 6,813 | 6,748 | 6,843 | 6,414 | 6,384 | 5,850 | 6,045 |
| 2020 | 5,586 | 5,526 | 5,469 | 3,955 | 4,892 | 5,840 | 6,032 | 6,045 | 5,734 | 6,072 | 5,786 | 5,663 |
| 2021 | 5,378 | 5,132 | 7,053 | 6,944 | 6,324 | 6,296 | 6,276 | 6,548 | 6,020 | 6,022 | 5,823 | 5,895 |
| 2022 | 5,092 | 5,163 | 6,172 | 6,018 | 6,397 | 6,003 | 6,040 | 6,084 | 5,900 | 5,683 | 5,578 | 5,973 |
| 2023 | 5,504 | 5,084 | 6,255 | 6,446 | 6,603 | 6,745 | 6,163 | 6,450 | 5,850 | 6,017 | 5,699 | 5,503 |
| 2024 | 4,934 | |||||||||||
| - = No Data Reported; -- = Not Applicable; NA = Not Available; W = Withheld to avoid disclosure of individual company data. |
| Release Date: 3/29/2024 |
| Next Release Date: 4/30/2024 |