|
Download Data (XLS File) |
|
||||||||
|
||||||||
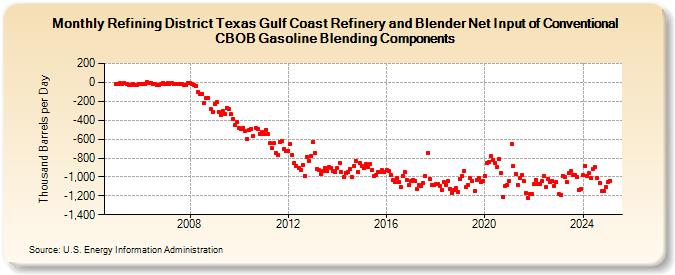
| Refining District Texas Gulf Coast Refinery and Blender Net Input of Conventional CBOB Gasoline Blending Components (Thousand Barrels per Day) | ||||||||
| Year | Jan | Feb | Mar | Apr | May | Jun | Jul | Aug | Sep | Oct | Nov | Dec |
|---|---|---|---|---|---|---|---|---|---|---|---|---|
| 2005 | -14 | -20 | -11 | -14 | -5 | -19 | -23 | -23 | -14 | -24 | -28 | -22 |
| 2006 | -15 | -15 | -14 | 0 | -7 | -5 | -14 | -20 | -23 | -23 | -16 | -3 |
| 2007 | -22 | -5 | -14 | -11 | -19 | -18 | -16 | -17 | -17 | -25 | -24 | -7 |
| 2008 | -10 | -18 | -25 | -33 | -107 | -122 | -118 | -219 | -163 | -164 | -286 | -314 |
| 2009 | -228 | -210 | -312 | -342 | -302 | -333 | -268 | -285 | -338 | -385 | -447 | -418 |
| 2010 | -480 | -493 | -478 | -517 | -595 | -505 | -489 | -564 | -479 | -491 | -543 | -525 |
| 2011 | -548 | -500 | -547 | -644 | -696 | -644 | -747 | -763 | -634 | -619 | -704 | -731 |
| 2012 | -723 | -655 | -769 | -849 | -881 | -901 | -925 | -876 | -987 | -785 | -828 | -774 |
| 2013 | -628 | -743 | -921 | -927 | -973 | -940 | -907 | -941 | -898 | -911 | -939 | -945 |
| 2014 | -911 | -858 | -953 | -1,001 | -955 | -944 | -917 | -1,001 | -888 | -828 | -943 | -858 |
| 2015 | -888 | -905 | -867 | -896 | -865 | -924 | -988 | -975 | -944 | -953 | -931 | -948 |
| 2016 | -925 | -940 | -977 | -1,033 | -1,053 | -1,014 | -1,056 | -1,104 | -991 | -951 | -1,034 | -1,088 |
| 2017 | -1,045 | -1,038 | -1,039 | -1,131 | -1,087 | -1,092 | -1,066 | -991 | -743 | -1,021 | -1,084 | -1,088 |
| 2018 | -1,080 | -1,075 | -1,098 | -1,135 | -1,059 | -1,087 | -1,041 | -1,126 | -1,166 | -1,139 | -1,117 | -1,160 |
| 2019 | -1,023 | -986 | -934 | -1,108 | -1,088 | -1,016 | -1,041 | -1,145 | -1,032 | -1,012 | -1,054 | -1,043 |
| 2020 | -991 | -851 | -839 | -780 | -820 | -855 | -899 | -813 | -959 | -1,212 | -1,094 | -1,087 |
| 2021 | -1,043 | -651 | -885 | -970 | -1,088 | -1,010 | -980 | -1,039 | -1,168 | -1,220 | -1,179 | -1,183 |
| 2022 | -1,080 | -1,031 | -1,073 | -1,075 | -1,045 | -995 | -1,109 | -1,022 | -1,059 | -1,043 | -1,098 | -1,058 |
| 2023 | -1,184 | -1,190 | -987 | -1,001 | -1,050 | -962 | -942 | -983 | -976 | -1,004 | -1,135 | -1,129 |
| 2024 | -985 | |||||||||||
| - = No Data Reported; -- = Not Applicable; NA = Not Available; W = Withheld to avoid disclosure of individual company data. |
| Release Date: 3/29/2024 |
| Next Release Date: 4/30/2024 |