|
Download Data (XLS File) |
|
||||||||
|
||||||||
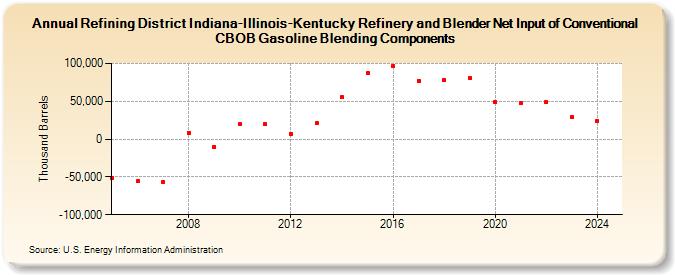
| Refining District Indiana-Illinois-Kentucky Refinery and Blender Net Input of Conventional CBOB Gasoline Blending Components (Thousand Barrels) | ||||||||
| Decade | Year-0 | Year-1 | Year-2 | Year-3 | Year-4 | Year-5 | Year-6 | Year-7 | Year-8 | Year-9 |
|---|---|---|---|---|---|---|---|---|---|---|
| 2000's | -51,617 | -55,609 | -57,177 | 8,533 | -9,975 | |||||
| 2010's | 19,409 | 19,566 | 7,128 | 21,199 | 55,217 | 87,324 | 96,676 | 77,346 | 78,133 | 80,844 |
| 2020's | 48,950 | 47,700 | 48,642 | 29,156 |
| - = No Data Reported; -- = Not Applicable; NA = Not Available; W = Withheld to avoid disclosure of individual company data. |
| Release Date: 3/29/2024 |
| Next Release Date: 8/30/2024 |