|
Download Data (XLS File) |
|
||||||||
|
||||||||
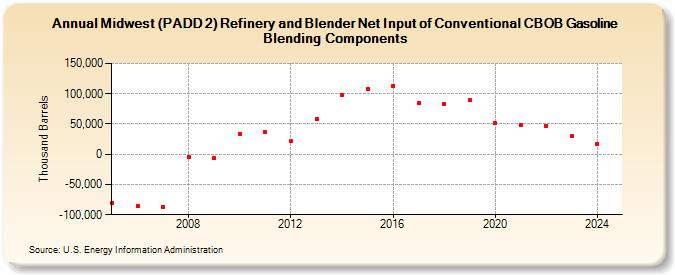
| Midwest (PADD 2) Refinery and Blender Net Input of Conventional CBOB Gasoline Blending Components (Thousand Barrels) | ||||||||
| Decade | Year-0 | Year-1 | Year-2 | Year-3 | Year-4 | Year-5 | Year-6 | Year-7 | Year-8 | Year-9 |
|---|---|---|---|---|---|---|---|---|---|---|
| 2000's | -80,710 | -85,361 | -86,863 | -4,628 | -6,582 | |||||
| 2010's | 32,634 | 36,166 | 21,319 | 57,494 | 97,873 | 108,023 | 112,931 | 83,907 | 83,550 | 89,001 |
| 2020's | 51,211 | 48,885 | 46,890 | 29,993 |
| - = No Data Reported; -- = Not Applicable; NA = Not Available; W = Withheld to avoid disclosure of individual company data. |
| Release Date: 3/29/2024 |
| Next Release Date: 8/30/2024 |