|
Download Data (XLS File) |
|
||||||||
|
||||||||
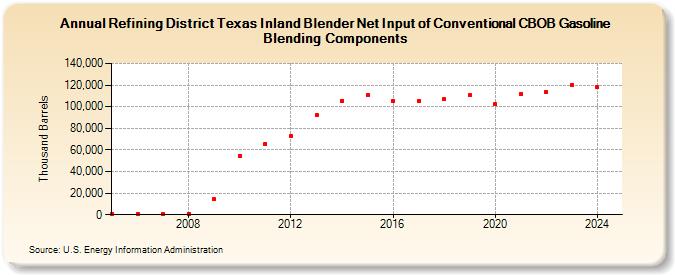
| Refining District Texas Inland Blender Net Input of Conventional CBOB Gasoline Blending Components (Thousand Barrels) | ||||||||
| Decade | Year-0 | Year-1 | Year-2 | Year-3 | Year-4 | Year-5 | Year-6 | Year-7 | Year-8 | Year-9 |
|---|---|---|---|---|---|---|---|---|---|---|
| 2000's | 864 | 763 | 741 | 1,043 | 14,242 | |||||
| 2010's | 54,773 | 65,709 | 73,321 | 92,444 | 105,704 | 110,450 | 105,257 | 105,289 | 106,770 | 110,717 |
| 2020's | 102,344 | 111,910 | 113,946 | 120,312 |
| - = No Data Reported; -- = Not Applicable; NA = Not Available; W = Withheld to avoid disclosure of individual company data. |
| Release Date: 8/30/2024 |
| Next Release Date: 8/29/2025 |