|
Download Data (XLS File) |
|
||||||||
|
||||||||
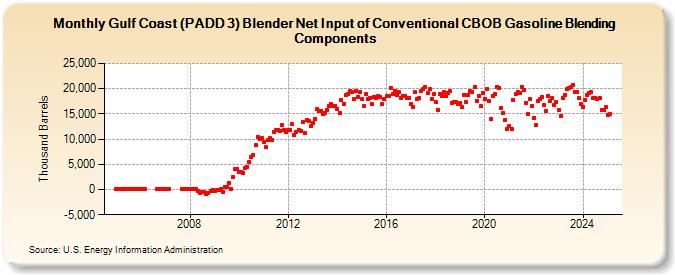
| Gulf Coast (PADD 3) Blender Net Input of Conventional CBOB Gasoline Blending Components (Thousand Barrels) | ||||||||
| Year | Jan | Feb | Mar | Apr | May | Jun | Jul | Aug | Sep | Oct | Nov | Dec |
|---|---|---|---|---|---|---|---|---|---|---|---|---|
| 2005 | 180 | 167 | 148 | 9 | 29 | 16 | 7 | 17 | 85 | 123 | 175 | 102 |
| 2006 | 136 | 89 | 119 | 56 | 149 | 146 | 149 | |||||
| 2007 | 143 | 139 | 133 | 67 | 115 | 119 | 104 | |||||
| 2008 | 40 | 20 | 130 | 79 | -277 | -764 | -492 | -556 | -836 | -727 | -232 | -22 |
| 2009 | -365 | -106 | -173 | 22 | -444 | 457 | 544 | 1,342 | 128 | 2,562 | 4,000 | 4,141 |
| 2010 | 3,510 | 3,553 | 3,285 | 4,237 | 4,536 | 5,549 | 6,435 | 6,893 | 8,766 | 10,473 | 10,049 | 10,127 |
| 2011 | 9,415 | 8,348 | 9,765 | 10,129 | 9,898 | 11,462 | 11,756 | 11,869 | 11,626 | 12,730 | 11,836 | 11,379 |
| 2012 | 11,714 | 11,782 | 12,910 | 10,905 | 11,488 | 11,874 | 11,596 | 13,408 | 11,241 | 13,842 | 13,592 | 12,543 |
| 2013 | 13,179 | 13,920 | 15,915 | 15,621 | 15,620 | 14,982 | 15,263 | 15,848 | 16,497 | 17,003 | 16,583 | 16,608 |
| 2014 | 15,972 | 15,247 | 17,821 | 16,956 | 18,792 | 18,930 | 19,442 | 19,266 | 17,871 | 19,601 | 18,443 | 19,310 |
| 2015 | 17,858 | 16,565 | 18,981 | 17,951 | 18,160 | 16,879 | 18,433 | 18,222 | 18,482 | 18,388 | 16,879 | 17,948 |
| 2016 | 18,511 | 18,587 | 20,219 | 18,979 | 19,502 | 18,668 | 19,411 | 18,188 | 18,478 | 18,510 | 18,241 | 18,227 |
| 2017 | 16,872 | 16,394 | 19,316 | 17,903 | 18,132 | 19,621 | 19,901 | 20,248 | 19,134 | 19,927 | 17,987 | 18,869 |
| 2018 | 17,260 | 15,818 | 18,862 | 18,529 | 19,350 | 18,585 | 19,202 | 19,445 | 17,227 | 17,367 | 17,304 | 17,049 |
| 2019 | 17,115 | 16,366 | 18,831 | 17,330 | 18,828 | 19,459 | 19,285 | 20,381 | 17,628 | 18,549 | 16,534 | 19,185 |
| 2020 | 17,887 | 19,923 | 17,511 | 13,939 | 18,577 | 18,883 | 20,357 | 20,199 | 16,264 | 15,275 | 13,840 | 12,026 |
| 2021 | 12,517 | 11,915 | 17,718 | 18,939 | 19,361 | 19,103 | 20,380 | 19,754 | 17,183 | 15,027 | 17,926 | 16,578 |
| 2022 | 14,253 | 12,828 | 17,476 | 17,876 | 18,421 | 16,678 | 15,506 | 18,524 | 17,559 | 18,220 | 16,848 | 17,375 |
| 2023 | 15,701 | 14,429 | 18,133 | 18,799 | 19,844 | 20,280 | 20,287 | 20,834 | 19,261 | 19,394 | 18,103 | 16,840 |
| 2024 | 16,447 | 17,725 | 18,835 | 19,093 | ||||||||
| - = No Data Reported; -- = Not Applicable; NA = Not Available; W = Withheld to avoid disclosure of individual company data. |
| Release Date: 6/28/2024 |
| Next Release Date: 7/31/2024 |