|
Download Data (XLS File) |
|
||||||||
|
||||||||
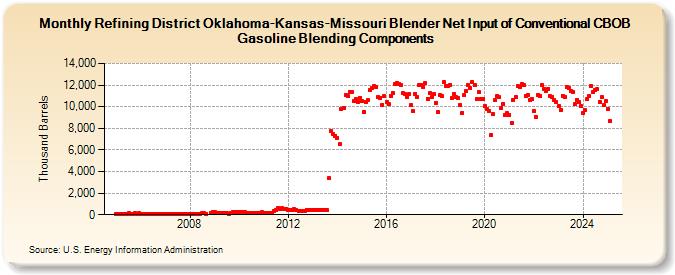
| Refining District Oklahoma-Kansas-Missouri Blender Net Input of Conventional CBOB Gasoline Blending Components (Thousand Barrels) | ||||||||
| Year | Jan | Feb | Mar | Apr | May | Jun | Jul | Aug | Sep | Oct | Nov | Dec |
|---|---|---|---|---|---|---|---|---|---|---|---|---|
| 2005 | 91 | 82 | 96 | 108 | 104 | 109 | 113 | 103 | 101 | 131 | 110 | 125 |
| 2006 | 104 | 106 | 91 | 100 | 106 | 70 | 52 | 98 | 102 | 88 | 87 | 100 |
| 2007 | 99 | 87 | 76 | 80 | 57 | 57 | 58 | 67 | 57 | 84 | 70 | 54 |
| 2008 | 26 | 40 | 57 | 44 | 48 | 70 | 117 | 114 | 51 | 177 | 235 | |
| 2009 | 225 | 202 | 197 | 184 | 178 | 123 | 122 | 79 | 199 | 252 | 232 | 251 |
| 2010 | 222 | 209 | 213 | 217 | 164 | 128 | 129 | 133 | 152 | 198 | 197 | 209 |
| 2011 | 186 | 165 | 196 | 196 | 181 | 370 | 442 | 655 | 493 | 593 | 554 | 562 |
| 2012 | 445 | 399 | 446 | 496 | 453 | 387 | 361 | 369 | 361 | 469 | 472 | 446 |
| 2013 | 440 | 408 | 446 | 451 | 424 | 395 | 416 | 409 | 3,361 | 7,724 | 7,463 | 7,331 |
| 2014 | 7,080 | 6,509 | 9,756 | 9,916 | 11,092 | 10,984 | 11,374 | 11,314 | 10,502 | 10,729 | 10,468 | 10,840 |
| 2015 | 10,512 | 9,539 | 10,392 | 10,584 | 11,549 | 11,736 | 11,908 | 11,801 | 10,874 | 10,840 | 10,182 | 10,948 |
| 2016 | 10,419 | 10,203 | 11,014 | 11,275 | 12,073 | 12,236 | 12,110 | 11,983 | 11,262 | 11,138 | 10,931 | 11,142 |
| 2017 | 10,137 | 9,558 | 11,214 | 10,919 | 12,023 | 12,002 | 11,856 | 12,153 | 10,755 | 11,246 | 10,890 | 11,173 |
| 2018 | 10,344 | 9,504 | 11,071 | 10,950 | 12,257 | 11,940 | 11,928 | 12,046 | 10,802 | 11,192 | 10,889 | 10,805 |
| 2019 | 10,153 | 9,438 | 11,040 | 11,430 | 11,978 | 11,722 | 12,293 | 12,014 | 10,749 | 11,330 | 10,743 | 10,720 |
| 2020 | 10,045 | 9,816 | 9,610 | 7,378 | 9,330 | 10,586 | 10,953 | 10,869 | 9,865 | 10,275 | 9,216 | 9,376 |
| 2021 | 9,254 | 8,472 | 10,640 | 10,892 | 11,923 | 11,846 | 12,094 | 11,973 | 10,992 | 11,049 | 10,622 | 10,667 |
| 2022 | 9,600 | 9,087 | 11,043 | 11,015 | 11,968 | 11,676 | 11,479 | 11,681 | 10,965 | 10,922 | 10,603 | 10,399 |
| 2023 | 10,045 | 9,701 | 11,002 | 10,901 | 11,807 | 11,695 | 11,432 | 11,391 | 10,210 | 10,662 | 10,400 | 10,086 |
| 2024 | 9,401 | |||||||||||
| - = No Data Reported; -- = Not Applicable; NA = Not Available; W = Withheld to avoid disclosure of individual company data. |
| Release Date: 3/29/2024 |
| Next Release Date: 4/30/2024 |