|
Download Data (XLS File) |
|
||||||||
|
||||||||
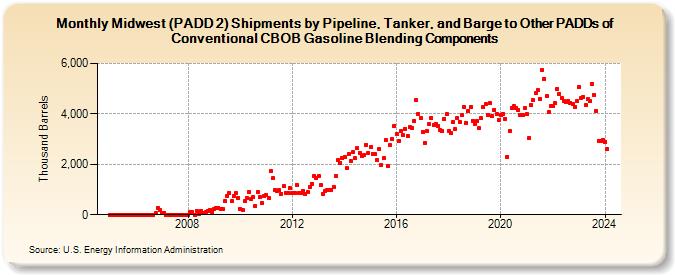
| Midwest (PADD 2) Shipments by Pipeline, Tanker, and Barge to Other PADDs of Conventional CBOB Gasoline Blending Components (Thousand Barrels) | ||||||||
| Year | Jan | Feb | Mar | Apr | May | Jun | Jul | Aug | Sep | Oct | Nov | Dec |
|---|---|---|---|---|---|---|---|---|---|---|---|---|
| 2005 | 0 | 0 | 0 | 0 | 0 | 0 | 0 | 0 | 0 | 0 | 0 | 0 |
| 2006 | 0 | 0 | 0 | 0 | 0 | 0 | 0 | 0 | 0 | 65 | 280 | 171 |
| 2007 | 83 | 83 | 0 | 0 | 0 | 0 | 0 | 0 | 0 | 0 | 4 | 4 |
| 2008 | 0 | 91 | 90 | 0 | 160 | 24 | 128 | 50 | 104 | 150 | 187 | 117 |
| 2009 | 237 | 283 | 283 | 218 | 210 | 548 | 738 | 871 | 540 | 729 | 845 | 668 |
| 2010 | 232 | 206 | 537 | 671 | 912 | 619 | 701 | 349 | 904 | 686 | 470 | 749 |
| 2011 | 784 | 679 | 1,715 | 1,443 | 961 | 948 | 969 | 838 | 1,120 | 878 | 881 | 1,044 |
| 2012 | 843 | 862 | 1,193 | 878 | 870 | 947 | 819 | 898 | 1,101 | 1,238 | 1,536 | 1,460 |
| 2013 | 1,523 | 1,163 | 822 | 940 | 964 | 975 | 999 | 1,094 | 1,530 | 2,173 | 2,058 | 2,235 |
| 2014 | 2,305 | 1,837 | 2,415 | 2,147 | 2,491 | 2,239 | 2,632 | 2,457 | 2,317 | 2,351 | 2,777 | 2,462 |
| 2015 | 2,690 | 2,415 | 2,393 | 2,179 | 2,598 | 1,982 | 2,241 | 2,973 | 1,925 | 2,754 | 3,009 | 3,538 |
| 2016 | 3,215 | 2,920 | 3,320 | 3,143 | 3,417 | 3,128 | 3,461 | 3,446 | 3,726 | 4,546 | 4,007 | 3,836 |
| 2017 | 3,296 | 2,864 | 3,328 | 3,586 | 3,846 | 3,566 | 3,603 | 3,526 | 3,371 | 3,321 | 3,813 | 3,977 |
| 2018 | 3,340 | 3,248 | 3,686 | 3,409 | 3,834 | 3,694 | 3,948 | 4,282 | 3,636 | 4,114 | 4,270 | 3,733 |
| 2019 | 3,609 | 3,723 | 3,423 | 3,820 | 4,272 | 4,375 | 3,939 | 4,414 | 3,898 | 4,161 | 3,990 | 3,770 |
| 2020 | 3,960 | 4,014 | 3,803 | 2,305 | 3,323 | 4,225 | 4,302 | 4,235 | 4,147 | 3,964 | 3,938 | 4,223 |
| 2021 | 3,982 | 3,041 | 4,371 | 4,547 | 4,818 | 4,940 | 4,610 | 5,759 | 5,390 | 4,705 | 4,072 | 4,309 |
| 2022 | 4,294 | 4,413 | 4,994 | 4,806 | 4,642 | 4,498 | 4,454 | 4,495 | 4,447 | 4,391 | 4,292 | 4,493 |
| 2023 | 5,071 | 4,632 | 4,689 | 4,333 | 4,573 | 4,504 | 5,205 | 4,760 | 4,120 | 2,927 | 2,932 | 2,973 |
| 2024 | 2,897 | |||||||||||
| - = No Data Reported; -- = Not Applicable; NA = Not Available; W = Withheld to avoid disclosure of individual company data. |
| Release Date: 3/29/2024 |
| Next Release Date: 4/30/2024 |
Referring Pages: