|
Download Data (XLS File) |
|
||||||||
|
||||||||
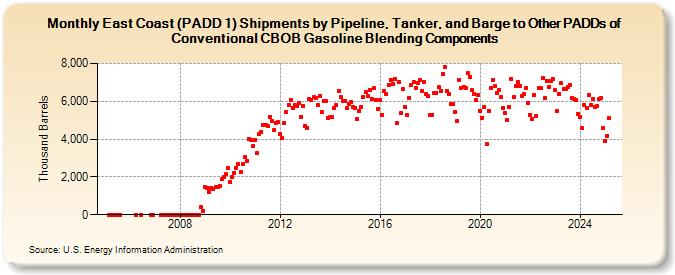
| East Coast (PADD 1) Shipments by Pipeline, Tanker, and Barge to Other PADDs of Conventional CBOB Gasoline Blending Components (Thousand Barrels) | ||||||||
| Year | Jan | Feb | Mar | Apr | May | Jun | Jul | Aug | Sep | Oct | Nov | Dec |
|---|---|---|---|---|---|---|---|---|---|---|---|---|
| 2005 | 0 | 0 | 0 | 0 | 0 | 0 | ||||||
| 2006 | 0 | 0 | 0 | 0 | ||||||||
| 2007 | 0 | 0 | 0 | 0 | 0 | 0 | 0 | 0 | 0 | |||
| 2008 | 0 | 0 | 0 | 0 | 0 | 0 | 0 | 0 | 0 | 0 | 386 | 220 |
| 2009 | 1,453 | 1,412 | 1,225 | 1,425 | 1,354 | 1,473 | 1,473 | 1,507 | 1,874 | 1,979 | 2,163 | 2,449 |
| 2010 | 1,755 | 1,988 | 2,212 | 2,477 | 2,676 | 2,272 | 2,666 | 3,032 | 2,841 | 4,000 | 3,977 | 3,640 |
| 2011 | 3,976 | 3,250 | 4,249 | 4,388 | 4,766 | 4,756 | 4,675 | 5,190 | 4,943 | 4,464 | 4,846 | 4,890 |
| 2012 | 4,295 | 4,037 | 4,878 | 5,432 | 5,821 | 6,092 | 5,670 | 5,783 | 5,727 | 5,911 | 5,186 | 5,740 |
| 2013 | 4,707 | 4,590 | 6,122 | 6,075 | 6,212 | 6,174 | 5,801 | 6,297 | 5,416 | 6,023 | 6,000 | 5,122 |
| 2014 | 5,143 | 5,148 | 5,653 | 5,800 | 6,556 | 6,225 | 6,001 | 5,996 | 5,625 | 5,876 | 5,942 | 5,704 |
| 2015 | 5,668 | 5,056 | 5,467 | 5,685 | 6,229 | 6,471 | 6,254 | 6,622 | 6,144 | 6,687 | 6,074 | 5,609 |
| 2016 | 6,056 | 5,280 | 6,529 | 6,361 | 6,844 | 7,137 | 6,898 | 7,184 | 4,849 | 7,012 | 5,376 | 6,656 |
| 2017 | 5,699 | 5,255 | 6,185 | 6,851 | 7,036 | 6,678 | 6,953 | 7,111 | 6,555 | 7,043 | 6,385 | 6,279 |
| 2018 | 5,283 | 5,281 | 6,416 | 6,460 | 6,739 | 6,529 | 7,453 | 7,840 | 6,565 | 6,364 | 5,844 | 5,852 |
| 2019 | 5,447 | 4,955 | 7,143 | 6,693 | 6,731 | 6,693 | 7,474 | 7,310 | 6,574 | 6,377 | 6,043 | 6,309 |
| 2020 | 5,481 | 5,134 | 5,705 | 3,749 | 5,498 | 6,723 | 7,119 | 6,807 | 6,421 | 6,603 | 6,216 | 5,654 |
| 2021 | 5,401 | 5,008 | 5,698 | 7,172 | 6,222 | 6,792 | 7,012 | 6,832 | 6,269 | 6,369 | 6,719 | 5,898 |
| 2022 | 5,277 | 5,085 | 6,327 | 5,211 | 6,679 | 6,715 | 7,233 | 6,168 | 7,098 | 6,770 | 7,090 | 7,153 |
| 2023 | 6,601 | 5,469 | 6,389 | 6,952 | 6,670 | 6,651 | 6,764 | 6,860 | 6,181 | 6,136 | 6,090 | 5,335 |
| 2024 | 5,186 | |||||||||||
| - = No Data Reported; -- = Not Applicable; NA = Not Available; W = Withheld to avoid disclosure of individual company data. |
| Release Date: 3/29/2024 |
| Next Release Date: 4/30/2024 |
Referring Pages: