|
Download Data (XLS File) |
|
||||||||
|
||||||||
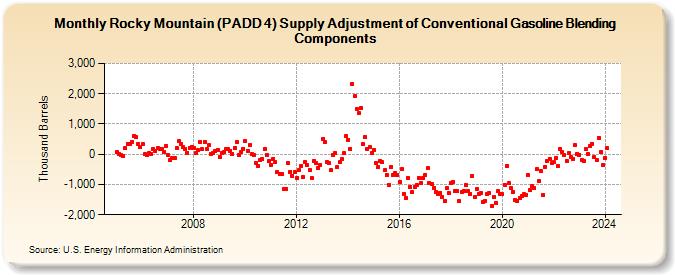
| Rocky Mountain (PADD 4) Supply Adjustment of Conventional Gasoline Blending Components (Thousand Barrels) | ||||||||
| Year | Jan | Feb | Mar | Apr | May | Jun | Jul | Aug | Sep | Oct | Nov | Dec |
|---|---|---|---|---|---|---|---|---|---|---|---|---|
| 2005 | 74 | 23 | -27 | -60 | 197 | 331 | 327 | 396 | 612 | 572 | 336 | 228 |
| 2006 | 341 | -2 | -38 | 47 | 13 | 175 | 120 | 194 | 165 | 175 | 64 | 281 |
| 2007 | -33 | -194 | -122 | -116 | 199 | 426 | 337 | 226 | 165 | 41 | 222 | 249 |
| 2008 | 195 | 44 | 137 | 413 | 171 | 413 | 168 | 294 | 16 | 40 | 107 | 152 |
| 2009 | -85 | 24 | 64 | 163 | 163 | 112 | 12 | 217 | 394 | -27 | 80 | 186 |
| 2010 | 436 | 123 | 313 | 3 | -34 | -278 | -394 | -202 | -150 | 165 | -23 | -227 |
| 2011 | -348 | -149 | -259 | -604 | -649 | -659 | -1,151 | -1,144 | -305 | -576 | -708 | -597 |
| 2012 | -785 | -527 | -391 | -753 | -273 | -359 | -535 | -784 | -221 | -299 | -441 | -358 |
| 2013 | 509 | 388 | -255 | -298 | -535 | -11 | 39 | -439 | -270 | -164 | 26 | 596 |
| 2014 | 475 | 188 | 2,320 | 1,923 | 1,483 | 1,353 | 1,533 | 325 | 566 | 186 | 231 | 50 |
| 2015 | 147 | -291 | -439 | -222 | -273 | -535 | -686 | -1,004 | -409 | -695 | -617 | -694 |
| 2016 | -926 | -504 | -1,317 | -1,443 | -791 | -1,073 | -1,246 | -1,080 | -1,016 | -777 | -962 | -789 |
| 2017 | -681 | -472 | -965 | -985 | -1,114 | -1,241 | -1,323 | -1,266 | -1,413 | -1,545 | -1,128 | -1,281 |
| 2018 | -940 | -903 | -1,203 | -1,220 | -1,557 | -1,237 | -1,216 | -1,018 | -1,217 | -1,301 | -721 | -1,411 |
| 2019 | -1,152 | -1,310 | -1,281 | -1,582 | -1,544 | -1,314 | -1,286 | -1,716 | -1,405 | -1,609 | -1,225 | -1,302 |
| 2020 | -1,317 | -1,006 | -386 | -965 | -1,133 | -1,234 | -1,508 | -1,559 | -1,450 | -1,374 | -1,325 | -1,333 |
| 2021 | -698 | -1,178 | -1,060 | -1,118 | -504 | -891 | -568 | -1,343 | -420 | -224 | -146 | -306 |
| 2022 | -265 | -136 | -375 | 169 | 60 | -28 | -210 | 34 | -100 | -158 | 302 | 8 |
| 2023 | -11 | -188 | -212 | 169 | 2 | 280 | 354 | -97 | -187 | 551 | 73 | -349 |
| 2024 | -110 | |||||||||||
| - = No Data Reported; -- = Not Applicable; NA = Not Available; W = Withheld to avoid disclosure of individual company data. |
| Release Date: 3/29/2024 |
| Next Release Date: 4/30/2024 |