|
Download Data (XLS File) |
|
||||||||
|
||||||||
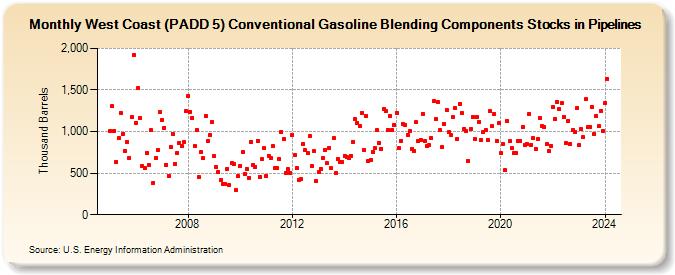
| West Coast (PADD 5) Conventional Gasoline Blending Components Stocks in Pipelines (Thousand Barrels) | ||||||||
| Year | Jan | Feb | Mar | Apr | May | Jun | Jul | Aug | Sep | Oct | Nov | Dec |
|---|---|---|---|---|---|---|---|---|---|---|---|---|
| 2005 | 1,009 | 1,302 | 1,005 | 638 | 918 | 1,224 | 973 | 764 | 875 | 680 | 1,172 | 1,925 |
| 2006 | 1,108 | 1,523 | 1,165 | 584 | 566 | 748 | 602 | 1,013 | 386 | 686 | 780 | 1,232 |
| 2007 | 1,142 | 1,047 | 601 | 471 | 819 | 966 | 613 | 744 | 863 | 832 | 873 | 1,244 |
| 2008 | 1,430 | 1,238 | 1,166 | 828 | 1,020 | 449 | 752 | 679 | 1,187 | 891 | 964 | 1,112 |
| 2009 | 701 | 568 | 512 | 417 | 374 | 375 | 551 | 360 | 623 | 608 | 292 | 462 |
| 2010 | 589 | 749 | 485 | 555 | 442 | 879 | 602 | 579 | 891 | 459 | 665 | 799 |
| 2011 | 465 | 710 | 682 | 822 | 558 | 561 | 670 | 992 | 912 | 507 | 546 | 503 |
| 2012 | 963 | 721 | 561 | 419 | 426 | 855 | 774 | 740 | 943 | 583 | 762 | 403 |
| 2013 | 508 | 553 | 676 | 781 | 616 | 801 | 561 | 920 | 496 | 675 | 630 | 636 |
| 2014 | 709 | 690 | 677 | 708 | 879 | 1,145 | 1,103 | 1,062 | 1,229 | 783 | 1,187 | 641 |
| 2015 | 659 | 758 | 804 | 1,014 | 863 | 795 | 1,277 | 1,242 | 1,020 | 1,190 | 1,022 | 1,082 |
| 2016 | 1,227 | 797 | 892 | 1,093 | 1,083 | 963 | 1,002 | 792 | 769 | 1,110 | 886 | 900 |
| 2017 | 1,215 | 885 | 829 | 834 | 922 | 1,365 | 1,145 | 1,358 | 1,020 | 809 | 1,093 | 1,259 |
| 2018 | 991 | 959 | 1,169 | 1,281 | 916 | 1,336 | 1,223 | 1,031 | 1,005 | 649 | 1,030 | 1,175 |
| 2019 | 911 | 1,174 | 1,120 | 895 | 993 | 1,018 | 900 | 1,243 | 1,063 | 1,213 | 891 | 1,098 |
| 2020 | 738 | 854 | 534 | 1,122 | 883 | 804 | 747 | 747 | 885 | 892 | 1,052 | 835 |
| 2021 | 848 | 1,212 | 844 | 919 | 792 | 911 | 1,165 | 1,066 | 1,051 | 849 | 767 | 830 |
| 2022 | 1,291 | 1,152 | 1,353 | 1,271 | 1,340 | 1,176 | 858 | 1,131 | 853 | 1,018 | 997 | 1,279 |
| 2023 | 840 | 1,026 | 930 | 1,388 | 1,058 | 1,059 | 1,299 | 975 | 1,187 | 1,061 | 1,249 | 1,007 |
| 2024 | 1,345 | |||||||||||
| - = No Data Reported; -- = Not Applicable; NA = Not Available; W = Withheld to avoid disclosure of individual company data. |
| Release Date: 3/29/2024 |
| Next Release Date: 4/30/2024 |