|
Download Data (XLS File) |
|
||||||||
|
||||||||
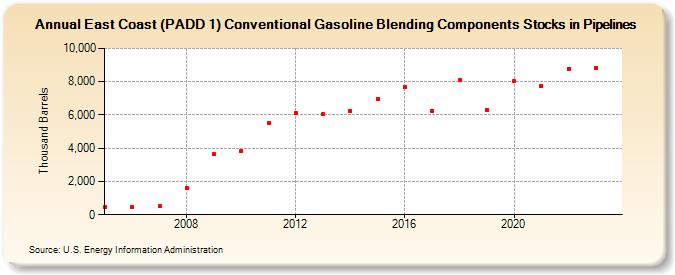
| East Coast (PADD 1) Conventional Gasoline Blending Components Stocks in Pipelines (Thousand Barrels) | ||||||||
| Decade | Year-0 | Year-1 | Year-2 | Year-3 | Year-4 | Year-5 | Year-6 | Year-7 | Year-8 | Year-9 |
|---|---|---|---|---|---|---|---|---|---|---|
| 2000's | 438 | 473 | 495 | 1,610 | 3,626 | |||||
| 2010's | 3,819 | 5,542 | 6,108 | 6,031 | 6,243 | 6,978 | 7,682 | 6,250 | 8,083 | 6,315 |
| 2020's | 8,013 | 7,714 | 8,783 | 8,808 |
| - = No Data Reported; -- = Not Applicable; NA = Not Available; W = Withheld to avoid disclosure of individual company data. |
| Release Date: 8/30/2024 |
| Next Release Date: 8/29/2025 |