|
Download Data (XLS File) |
|
||||||||
|
||||||||
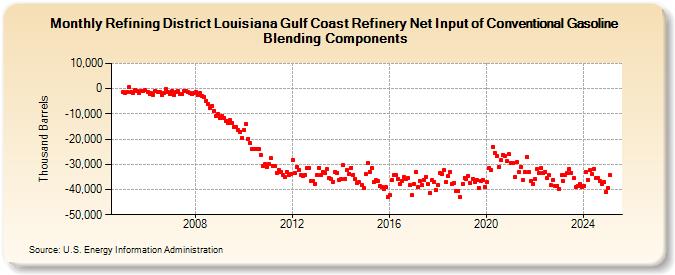
| Refining District Louisiana Gulf Coast Refinery Net Input of Conventional Gasoline Blending Components (Thousand Barrels) | ||||||||
| Year | Jan | Feb | Mar | Apr | May | Jun | Jul | Aug | Sep | Oct | Nov | Dec |
|---|---|---|---|---|---|---|---|---|---|---|---|---|
| 2005 | -1,194 | -1,736 | -1,305 | 646 | -1,348 | -1,619 | -357 | -881 | -1,554 | -1,091 | -734 | -640 |
| 2006 | -1,234 | -2,142 | -1,712 | -2,402 | -769 | -1,356 | -1,429 | -2,626 | -1,680 | -204 | -1,344 | -2,110 |
| 2007 | -1,038 | -2,394 | -1,456 | -965 | -2,155 | -2,149 | -1,029 | -982 | -1,444 | -1,613 | -2,159 | -1,603 |
| 2008 | -1,324 | -2,405 | -1,805 | -2,723 | -3,289 | -4,718 | -6,112 | -7,596 | -6,753 | -8,693 | -10,806 | -10,080 |
| 2009 | -11,666 | -10,828 | -11,697 | -12,808 | -13,649 | -12,587 | -13,516 | -15,002 | -15,273 | -16,474 | -16,996 | -19,580 |
| 2010 | -16,390 | -14,107 | -19,768 | -21,625 | -23,775 | -23,818 | -23,877 | -23,759 | -26,167 | -30,685 | -30,009 | -31,192 |
| 2011 | -30,034 | -27,540 | -30,525 | -30,517 | -33,294 | -32,074 | -32,956 | -34,121 | -35,055 | -32,911 | -34,209 | -33,832 |
| 2012 | -28,458 | -33,294 | -31,199 | -32,237 | -34,050 | -34,556 | -34,229 | -31,320 | -31,335 | -36,485 | -36,668 | -37,667 |
| 2013 | -34,416 | -31,406 | -34,242 | -32,948 | -33,403 | -32,030 | -35,253 | -35,991 | -36,881 | -32,912 | -33,410 | -36,228 |
| 2014 | -35,794 | -30,330 | -35,781 | -32,287 | -33,695 | -31,352 | -34,136 | -35,743 | -37,293 | -37,153 | -38,279 | -39,578 |
| 2015 | -34,009 | -29,568 | -33,002 | -31,501 | -37,149 | -36,373 | -36,705 | -38,570 | -38,850 | -39,777 | -38,921 | -42,807 |
| 2016 | -42,302 | -36,316 | -34,408 | -34,287 | -35,762 | -37,617 | -36,580 | -34,998 | -35,918 | -35,537 | -38,123 | -42,344 |
| 2017 | -37,767 | -33,065 | -38,983 | -36,680 | -38,294 | -36,078 | -34,917 | -37,781 | -41,192 | -36,336 | -36,973 | -40,103 |
| 2018 | -38,253 | -33,536 | -33,775 | -32,347 | -37,109 | -34,674 | -33,078 | -37,729 | -37,363 | -40,615 | -40,744 | -42,927 |
| 2019 | -37,753 | -35,263 | -35,740 | -34,688 | -37,464 | -35,681 | -36,830 | -36,217 | -39,255 | -36,580 | -36,277 | -38,952 |
| 2020 | -37,204 | -31,609 | -32,192 | -22,954 | -25,426 | -26,511 | -31,219 | -28,277 | -26,167 | -26,741 | -28,862 | -25,985 |
| 2021 | -29,608 | -29,594 | -35,137 | -29,233 | -33,070 | -31,109 | -36,403 | -33,123 | -27,073 | -33,127 | -36,587 | -37,773 |
| 2022 | -35,901 | -32,015 | -33,395 | -31,437 | -33,588 | -32,932 | -35,544 | -34,376 | -38,356 | -36,141 | -38,738 | -38,477 |
| 2023 | -39,826 | -34,405 | -36,645 | -34,149 | -33,628 | -31,694 | -33,331 | -35,607 | -39,173 | -38,618 | -37,780 | -39,128 |
| 2024 | -38,425 | |||||||||||
| - = No Data Reported; -- = Not Applicable; NA = Not Available; W = Withheld to avoid disclosure of individual company data. |
| Release Date: 3/29/2024 |
| Next Release Date: 4/30/2024 |