|
Download Data (XLS File) |
|
||||||||
|
||||||||
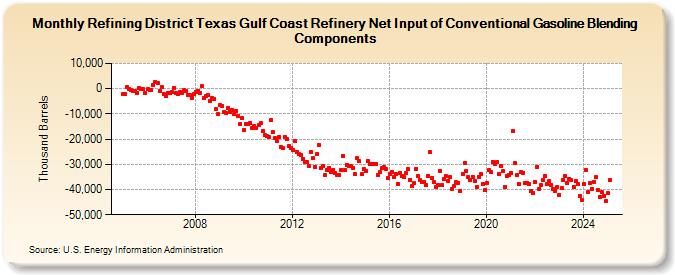
| Refining District Texas Gulf Coast Refinery Net Input of Conventional Gasoline Blending Components (Thousand Barrels) | ||||||||
| Year | Jan | Feb | Mar | Apr | May | Jun | Jul | Aug | Sep | Oct | Nov | Dec |
|---|---|---|---|---|---|---|---|---|---|---|---|---|
| 2005 | -2,123 | -2,223 | 600 | 20 | -719 | -1,064 | -1,087 | -1,763 | 221 | -247 | -268 | -1,656 |
| 2006 | -274 | -487 | -676 | 1,423 | 2,761 | 2,271 | -902 | 495 | -2,138 | -3,004 | -1,623 | -1,797 |
| 2007 | -1,428 | 452 | -1,646 | -2,273 | -1,309 | -1,539 | -709 | -789 | -2,684 | -2,513 | -3,549 | -2,260 |
| 2008 | -1,283 | -763 | -1,537 | 937 | -3,644 | -2,887 | -2,690 | -4,912 | -3,661 | -4,178 | -8,133 | -10,112 |
| 2009 | -6,612 | -6,772 | -9,343 | -9,662 | -7,731 | -9,406 | -8,575 | -10,055 | -8,710 | -10,787 | -14,058 | -11,813 |
| 2010 | -16,352 | -13,855 | -14,041 | -13,711 | -15,516 | -14,836 | -15,403 | -14,332 | -13,673 | -16,808 | -18,543 | -18,849 |
| 2011 | -19,047 | -12,609 | -17,188 | -19,706 | -20,768 | -19,312 | -23,076 | -23,371 | -19,044 | -20,123 | -22,697 | -23,365 |
| 2012 | -24,261 | -20,907 | -25,012 | -26,036 | -26,386 | -27,797 | -29,138 | -29,166 | -30,635 | -24,958 | -27,454 | -31,030 |
| 2013 | -26,049 | -22,168 | -31,370 | -30,807 | -34,314 | -32,064 | -31,283 | -33,226 | -32,142 | -33,439 | -34,059 | -34,343 |
| 2014 | -32,303 | -26,791 | -32,292 | -30,113 | -30,863 | -30,830 | -31,425 | -33,984 | -27,663 | -28,870 | -33,996 | -31,960 |
| 2015 | -32,685 | -28,712 | -29,904 | -29,771 | -29,786 | -29,713 | -34,265 | -33,132 | -31,405 | -31,164 | -31,738 | -35,533 |
| 2016 | -33,752 | -32,863 | -34,932 | -34,034 | -37,837 | -33,475 | -34,812 | -35,137 | -33,635 | -31,893 | -36,100 | -38,662 |
| 2017 | -37,562 | -31,778 | -34,645 | -36,391 | -37,111 | -36,948 | -38,256 | -34,624 | -25,270 | -35,349 | -37,183 | -38,940 |
| 2018 | -38,280 | -32,558 | -38,370 | -35,987 | -34,830 | -36,451 | -35,155 | -39,608 | -38,482 | -37,115 | -37,272 | -40,633 |
| 2019 | -33,933 | -29,629 | -32,716 | -35,044 | -36,324 | -34,923 | -36,633 | -39,062 | -35,193 | -33,952 | -37,839 | -40,260 |
| 2020 | -37,382 | -32,168 | -33,043 | -28,946 | -29,829 | -29,157 | -33,788 | -30,493 | -32,806 | -38,835 | -34,734 | -34,077 |
| 2021 | -33,432 | -16,966 | -29,324 | -34,380 | -37,731 | -33,166 | -33,256 | -37,451 | -37,286 | -37,992 | -40,633 | -41,464 |
| 2022 | -36,889 | -30,942 | -39,705 | -38,122 | -36,211 | -34,757 | -37,841 | -36,803 | -38,092 | -39,838 | -40,473 | -39,058 |
| 2023 | -42,259 | -39,390 | -36,245 | -34,566 | -37,577 | -35,694 | -36,382 | -38,948 | -36,670 | -37,744 | -42,508 | -44,141 |
| 2024 | -37,914 | |||||||||||
| - = No Data Reported; -- = Not Applicable; NA = Not Available; W = Withheld to avoid disclosure of individual company data. |
| Release Date: 3/29/2024 |
| Next Release Date: 4/30/2024 |