|
Download Data (XLS File) |
|
||||||||
|
||||||||
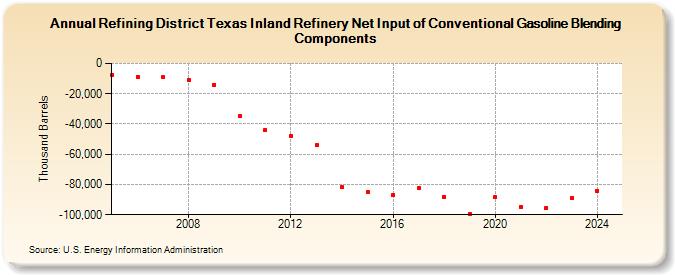
| Refining District Texas Inland Refinery Net Input of Conventional Gasoline Blending Components (Thousand Barrels) | ||||||||
| Decade | Year-0 | Year-1 | Year-2 | Year-3 | Year-4 | Year-5 | Year-6 | Year-7 | Year-8 | Year-9 |
|---|---|---|---|---|---|---|---|---|---|---|
| 2000's | -7,486 | -8,841 | -9,176 | -10,883 | -14,017 | |||||
| 2010's | -34,875 | -44,100 | -47,841 | -53,941 | -81,977 | -85,127 | -87,277 | -82,067 | -88,036 | -99,332 |
| 2020's | -88,512 | -94,666 | -95,273 | -88,965 |
| - = No Data Reported; -- = Not Applicable; NA = Not Available; W = Withheld to avoid disclosure of individual company data. |
| Release Date: 8/30/2024 |
| Next Release Date: 8/29/2025 |