|
Download Data (XLS File) |
|
||||||||
|
||||||||
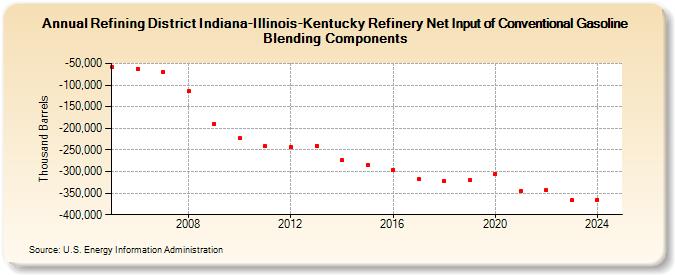
| Refining District Indiana-Illinois-Kentucky Refinery Net Input of Conventional Gasoline Blending Components (Thousand Barrels) | ||||||||
| Decade | Year-0 | Year-1 | Year-2 | Year-3 | Year-4 | Year-5 | Year-6 | Year-7 | Year-8 | Year-9 |
|---|---|---|---|---|---|---|---|---|---|---|
| 2000's | -58,881 | -62,602 | -69,750 | -113,775 | -189,543 | |||||
| 2010's | -222,750 | -241,136 | -242,295 | -240,096 | -274,220 | -284,455 | -295,691 | -317,426 | -322,330 | -320,604 |
| 2020's | -305,240 | -345,531 | -343,655 | -366,616 |
| - = No Data Reported; -- = Not Applicable; NA = Not Available; W = Withheld to avoid disclosure of individual company data. |
| Release Date: 3/29/2024 |
| Next Release Date: 8/30/2024 |