|
Download Data (XLS File) |
|
||||||||
|
||||||||
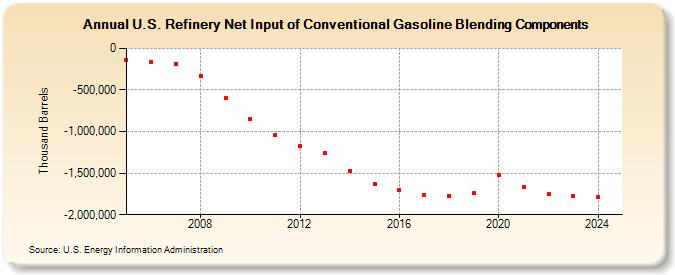
| U.S. Refinery Net Input of Conventional Gasoline Blending Components (Thousand Barrels) | ||||||||
| Decade | Year-0 | Year-1 | Year-2 | Year-3 | Year-4 | Year-5 | Year-6 | Year-7 | Year-8 | Year-9 |
|---|---|---|---|---|---|---|---|---|---|---|
| 2000's | -139,828 | -161,788 | -186,830 | -328,253 | -591,173 | |||||
| 2010's | -847,742 | -1,045,698 | -1,175,431 | -1,258,850 | -1,476,906 | -1,625,421 | -1,698,515 | -1,758,018 | -1,780,697 | -1,737,927 |
| 2020's | -1,527,856 | -1,671,747 | -1,746,563 | -1,777,109 |
| - = No Data Reported; -- = Not Applicable; NA = Not Available; W = Withheld to avoid disclosure of individual company data. |
| Release Date: 3/29/2024 |
| Next Release Date: 8/30/2024 |