|
Download Data (XLS File) |
|
||||||||
|
||||||||
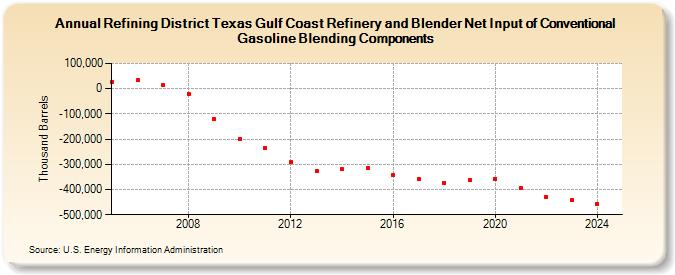
| Refining District Texas Gulf Coast Refinery and Blender Net Input of Conventional Gasoline Blending Components (Thousand Barrels) | ||||||||
| Decade | Year-0 | Year-1 | Year-2 | Year-3 | Year-4 | Year-5 | Year-6 | Year-7 | Year-8 | Year-9 |
|---|---|---|---|---|---|---|---|---|---|---|
| 2000's | 27,258 | 33,081 | 13,352 | -20,019 | -119,815 | |||||
| 2010's | -200,313 | -236,192 | -292,277 | -325,794 | -318,758 | -315,518 | -342,913 | -356,677 | -372,847 | -362,939 |
| 2020's | -357,248 | -393,906 | -429,382 | -441,453 |
| - = No Data Reported; -- = Not Applicable; NA = Not Available; W = Withheld to avoid disclosure of individual company data. |
| Release Date: 3/29/2024 |
| Next Release Date: 8/30/2024 |