|
Download Data (XLS File) |
|
||||||||
|
||||||||
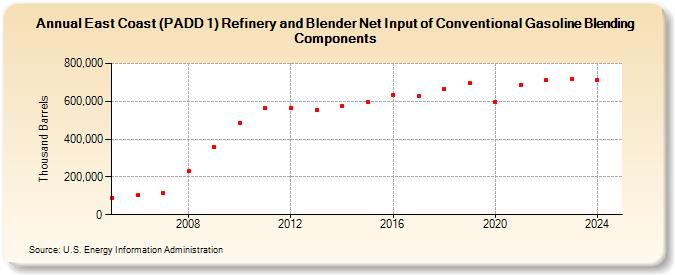
| East Coast (PADD 1) Refinery and Blender Net Input of Conventional Gasoline Blending Components (Thousand Barrels) | ||||||||
| Decade | Year-0 | Year-1 | Year-2 | Year-3 | Year-4 | Year-5 | Year-6 | Year-7 | Year-8 | Year-9 |
|---|---|---|---|---|---|---|---|---|---|---|
| 2000's | 90,548 | 103,899 | 114,478 | 229,449 | 358,360 | |||||
| 2010's | 486,407 | 562,160 | 564,867 | 556,406 | 577,161 | 596,837 | 635,409 | 628,665 | 662,669 | 694,414 |
| 2020's | 597,414 | 684,627 | 711,741 | 719,371 |
| - = No Data Reported; -- = Not Applicable; NA = Not Available; W = Withheld to avoid disclosure of individual company data. |
| Release Date: 3/29/2024 |
| Next Release Date: 8/30/2024 |