|
Download Data (XLS File) |
|
||||||||
|
||||||||
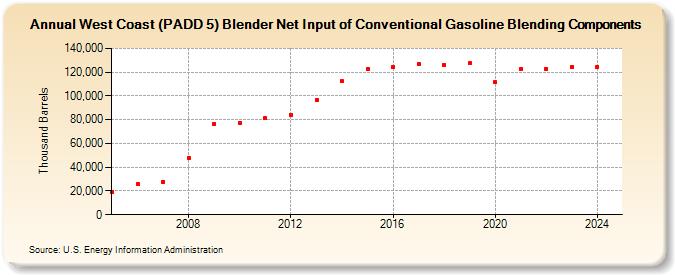
| West Coast (PADD 5) Blender Net Input of Conventional Gasoline Blending Components (Thousand Barrels) | ||||||||
| Decade | Year-0 | Year-1 | Year-2 | Year-3 | Year-4 | Year-5 | Year-6 | Year-7 | Year-8 | Year-9 |
|---|---|---|---|---|---|---|---|---|---|---|
| 2000's | 18,997 | 25,962 | 27,923 | 47,841 | 76,457 | |||||
| 2010's | 77,376 | 81,035 | 84,037 | 96,876 | 112,421 | 122,508 | 124,455 | 127,014 | 126,358 | 127,432 |
| 2020's | 111,557 | 122,440 | 122,855 | 124,666 |
| - = No Data Reported; -- = Not Applicable; NA = Not Available; W = Withheld to avoid disclosure of individual company data. |
| Release Date: 4/30/2024 |
| Next Release Date: 8/30/2024 |