|
Download Data (XLS File) |
|
||||||||
|
||||||||
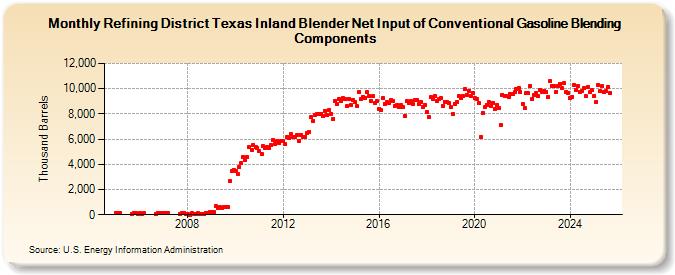
| Refining District Texas Inland Blender Net Input of Conventional Gasoline Blending Components (Thousand Barrels) | ||||||||
| Year | Jan | Feb | Mar | Apr | May | Jun | Jul | Aug | Sep | Oct | Nov | Dec |
|---|---|---|---|---|---|---|---|---|---|---|---|---|
| 2005 | 161 | 148 | 148 | 68 | 105 | 155 | 79 | |||||
| 2006 | 115 | 71 | 119 | 56 | 137 | 130 | 135 | |||||
| 2007 | 128 | 126 | 133 | 52 | 115 | 101 | 86 | |||||
| 2008 | 24 | 4 | 113 | 78 | 90 | 100 | 68 | 32 | 86 | 162 | 150 | 182 |
| 2009 | 208 | 231 | 654 | 543 | 574 | 566 | 582 | 606 | 639 | 2,648 | 3,435 | 3,575 |
| 2010 | 3,504 | 3,259 | 3,825 | 4,076 | 4,595 | 4,378 | 4,549 | 5,357 | 5,106 | 5,519 | 5,342 | 5,266 |
| 2011 | 5,028 | 4,784 | 5,443 | 5,306 | 5,338 | 5,271 | 5,531 | 5,934 | 5,646 | 5,864 | 5,714 | 5,853 |
| 2012 | 5,821 | 5,604 | 6,186 | 6,064 | 6,383 | 6,127 | 6,194 | 6,345 | 5,868 | 6,364 | 6,159 | 6,206 |
| 2013 | 6,507 | 6,581 | 7,724 | 7,433 | 7,907 | 7,973 | 7,960 | 8,024 | 7,866 | 8,263 | 7,890 | 8,316 |
| 2014 | 8,009 | 7,616 | 9,059 | 8,782 | 9,191 | 8,989 | 9,225 | 9,214 | 8,599 | 9,175 | 8,714 | 9,131 |
| 2015 | 8,919 | 8,592 | 9,747 | 9,172 | 9,363 | 9,289 | 9,710 | 9,415 | 9,003 | 9,389 | 8,857 | 8,994 |
| 2016 | 8,416 | 8,278 | 9,248 | 8,777 | 8,953 | 8,825 | 9,130 | 9,029 | 8,658 | 8,744 | 8,511 | 8,688 |
| 2017 | 8,509 | 7,812 | 9,016 | 8,873 | 8,986 | 8,806 | 9,136 | 9,095 | 8,813 | 8,940 | 8,562 | 8,741 |
| 2018 | 8,175 | 7,771 | 9,329 | 9,217 | 9,410 | 9,021 | 9,166 | 9,260 | 8,649 | 8,977 | 8,947 | 8,848 |
| 2019 | 8,549 | 7,982 | 8,819 | 8,939 | 9,381 | 9,227 | 9,418 | 9,970 | 9,501 | 9,841 | 9,432 | 9,658 |
| 2020 | 9,254 | 9,205 | 8,828 | 6,165 | 8,107 | 8,524 | 8,730 | 8,941 | 8,593 | 8,881 | 8,401 | 8,715 |
| 2021 | 8,454 | 7,104 | 9,531 | 9,410 | 9,393 | 9,351 | 9,576 | 9,585 | 9,729 | 9,956 | 10,045 | 9,776 |
| 2022 | 8,809 | 8,481 | 9,639 | 9,637 | 10,202 | 9,208 | 9,466 | 9,654 | 9,419 | 9,913 | 9,713 | 9,805 |
| 2023 | 9,654 | 9,222 | 10,540 | 10,215 | 10,211 | 9,891 | 10,181 | 10,403 | 10,065 | 10,424 | 9,726 | 9,613 |
| 2024 | 9,294 | |||||||||||
| - = No Data Reported; -- = Not Applicable; NA = Not Available; W = Withheld to avoid disclosure of individual company data. |
| Release Date: 3/29/2024 |
| Next Release Date: 4/30/2024 |