|
Download Data (XLS File) |
|
||||||||
|
||||||||
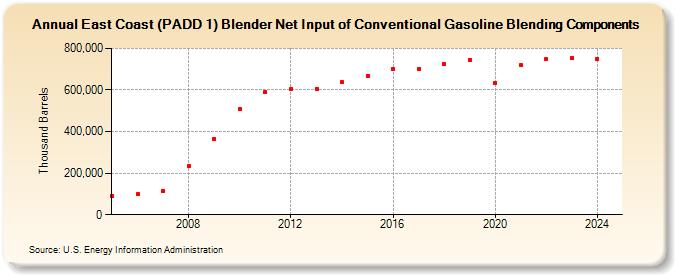
| East Coast (PADD 1) Blender Net Input of Conventional Gasoline Blending Components (Thousand Barrels) | ||||||||
| Decade | Year-0 | Year-1 | Year-2 | Year-3 | Year-4 | Year-5 | Year-6 | Year-7 | Year-8 | Year-9 |
|---|---|---|---|---|---|---|---|---|---|---|
| 2000's | 89,442 | 99,753 | 114,016 | 233,117 | 364,645 | |||||
| 2010's | 507,844 | 589,229 | 603,594 | 606,166 | 638,241 | 668,085 | 699,657 | 698,828 | 727,079 | 745,670 |
| 2020's | 633,452 | 719,392 | 747,662 | 755,076 |
| - = No Data Reported; -- = Not Applicable; NA = Not Available; W = Withheld to avoid disclosure of individual company data. |
| Release Date: 3/29/2024 |
| Next Release Date: 8/30/2024 |