|
Download Data (XLS File) |
|
||||||||
|
||||||||
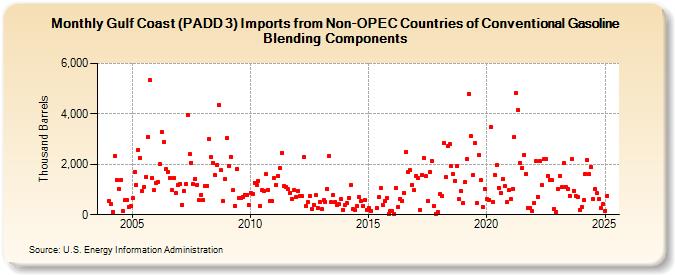
| Gulf Coast (PADD 3) Imports from Non-OPEC Countries of Conventional Gasoline Blending Components (Thousand Barrels) | ||||||||
| Year | Jan | Feb | Mar | Apr | May | Jun | Jul | Aug | Sep | Oct | Nov | Dec |
|---|---|---|---|---|---|---|---|---|---|---|---|---|
| 2004 | 527 | 412 | 118 | 2,329 | 1,375 | 1,014 | 1,397 | 143 | 581 | 566 | 306 | 326 |
| 2005 | 648 | 1,714 | 1,197 | 2,587 | 2,262 | 924 | 1,103 | 1,511 | 3,095 | 5,325 | 1,463 | 975 |
| 2006 | 1,262 | 1,302 | 2,000 | 3,289 | 2,881 | 1,796 | 1,689 | 1,465 | 991 | 1,474 | 874 | 1,167 |
| 2007 | 1,212 | 405 | 940 | 1,215 | 3,963 | 2,397 | 2,068 | 1,202 | 1,435 | 1,179 | 568 | 791 |
| 2008 | 583 | 1,146 | 1,158 | 2,992 | 2,279 | 2,070 | 1,575 | 1,973 | 4,358 | 1,756 | 538 | 1,429 |
| 2009 | 3,034 | 1,925 | 2,290 | 967 | 360 | 1,806 | 660 | 655 | 699 | 792 | 792 | 402 |
| 2010 | 880 | 839 | 1,269 | 1,178 | 1,351 | 344 | 980 | 955 | 1,596 | 997 | 526 | 526 |
| 2011 | 1,452 | 1,189 | 1,536 | 1,836 | 2,466 | 1,144 | 1,110 | 1,004 | 874 | 642 | 976 | 684 |
| 2012 | 954 | 752 | 737 | 2,272 | 355 | 498 | 728 | 207 | 401 | 771 | 273 | 509 |
| 2013 | 221 | 575 | 520 | 1,025 | 2,339 | 494 | 794 | 497 | 386 | 417 | 611 | 199 |
| 2014 | 398 | 449 | 659 | 1,179 | 218 | 181 | 330 | 701 | 527 | 328 | 573 | 198 |
| 2015 | 285 | 153 | 272 | 684 | 1,046 | 398 | 546 | 679 | 24 | 150 | ||
| 2016 | 144 | 18 | 1,061 | 300 | 635 | 545 | 872 | 2,498 | 1,682 | 1,773 | 1,192 | 967 |
| 2017 | 1,553 | 1,456 | 195 | 1,583 | 2,269 | 1,524 | 560 | 1,692 | 2,140 | 352 | 26 | 89 |
| 2018 | 809 | 737 | 2,850 | 1,486 | 2,712 | 2,788 | 1,924 | 1,601 | 1,341 | 1,917 | 617 | 955 |
| 2019 | 445 | 1,293 | 2,196 | 4,780 | 3,109 | 1,591 | 2,832 | 474 | 2,373 | 1,381 | 292 | 1,016 |
| 2020 | 611 | 599 | 3,467 | 495 | 1,595 | 1,956 | 1,061 | 862 | 1,414 | 1,137 | 485 | 961 |
| 2021 | 604 | 1,031 | 3,085 | 4,834 | 4,149 | 2,062 | 1,863 | 2,387 | 1,616 | 285 | 256 | 134 |
| 2022 | 479 | 2,123 | 713 | 2,120 | 1,175 | 2,198 | 2,220 | 1,538 | 1,384 | 1,359 | 238 | 127 |
| 2023 | 1,028 | 1,542 | 1,086 | 2,038 | 1,116 | 1,035 | 753 | 2,207 | 960 | 755 | 704 | 189 |
| 2024 | 299 | |||||||||||
| - = No Data Reported; -- = Not Applicable; NA = Not Available; W = Withheld to avoid disclosure of individual company data. |
| Release Date: 3/29/2024 |
| Next Release Date: 4/30/2024 |