|
Download Data (XLS File) |
|
||||||||
|
||||||||
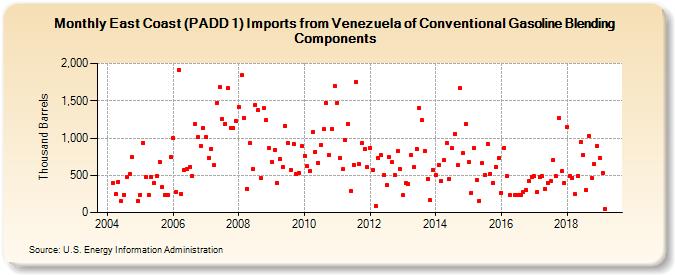
| East Coast (PADD 1) Imports from Venezuela of Conventional Gasoline Blending Components (Thousand Barrels) | ||||||||
| Year | Jan | Feb | Mar | Apr | May | Jun | Jul | Aug | Sep | Oct | Nov | Dec |
|---|---|---|---|---|---|---|---|---|---|---|---|---|
| 2004 | 403 | 245 | 410 | 150 | 239 | 477 | 519 | 741 | 149 | |||
| 2005 | 240 | 939 | 480 | 239 | 480 | 403 | 488 | 682 | 342 | 240 | 240 | 747 |
| 2006 | 997 | 270 | 1,913 | 250 | 575 | 585 | 612 | 491 | 1,183 | 1,008 | 893 | 1,141 |
| 2007 | 1,009 | 738 | 858 | 634 | 1,474 | 1,681 | 1,254 | 1,193 | 1,665 | 1,141 | 1,136 | 1,225 |
| 2008 | 1,412 | 1,839 | 1,272 | 322 | 932 | 579 | 1,446 | 1,372 | 458 | 1,397 | 1,241 | 861 |
| 2009 | 683 | 844 | 403 | 717 | 614 | 1,160 | 934 | 574 | 920 | 511 | 533 | 889 |
| 2010 | 765 | 621 | 553 | 1,079 | 818 | 670 | 912 | 1,121 | 1,465 | 773 | 1,127 | 1,699 |
| 2011 | 1,470 | 733 | 580 | 976 | 1,190 | 292 | 642 | 1,753 | 650 | 928 | 857 | 606 |
| 2012 | 869 | 574 | 92 | 728 | 767 | 506 | 367 | 741 | 674 | 501 | 828 | 584 |
| 2013 | 230 | 396 | 380 | 773 | 611 | 854 | 1,408 | 1,236 | 822 | 455 | 164 | 574 |
| 2014 | 507 | 639 | 421 | 699 | 929 | 455 | 862 | 1,060 | 634 | 1,669 | 797 | 1,188 |
| 2015 | 673 | 266 | 866 | 438 | 161 | 659 | 503 | 925 | 521 | 398 | 613 | 733 |
| 2016 | 266 | 871 | 487 | 237 | 242 | 240 | 239 | 273 | 309 | 420 | 483 | |
| 2017 | 487 | 270 | 478 | 487 | 317 | 402 | 419 | 703 | 485 | 1,270 | 552 | 396 |
| 2018 | 1,154 | 486 | 465 | 246 | 496 | 943 | 770 | 301 | 1,029 | 464 | 657 | 890 |
| 2019 | 732 | 532 | 42 | |||||||||
| - = No Data Reported; -- = Not Applicable; NA = Not Available; W = Withheld to avoid disclosure of individual company data. |
| Release Date: 3/29/2024 |
| Next Release Date: 4/30/2024 |