|
Download Data (XLS File) |
|
||||||||
|
||||||||
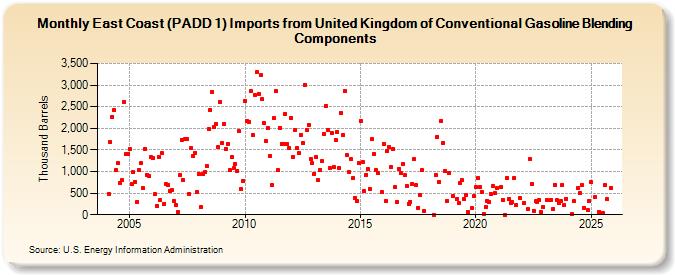
| East Coast (PADD 1) Imports from United Kingdom of Conventional Gasoline Blending Components (Thousand Barrels) | ||||||||
| Year | Jan | Feb | Mar | Apr | May | Jun | Jul | Aug | Sep | Oct | Nov | Dec |
|---|---|---|---|---|---|---|---|---|---|---|---|---|
| 2004 | 482 | 1,686 | 2,271 | 2,414 | 1,031 | 1,196 | 744 | 795 | 2,620 | 1,403 | 1,397 | |
| 2005 | 1,519 | 722 | 978 | 759 | 297 | 1,034 | 1,187 | 608 | 1,524 | 927 | 887 | 1,328 |
| 2006 | 1,302 | 472 | 211 | 1,344 | 346 | 1,422 | 255 | 703 | 699 | 547 | 565 | 313 |
| 2007 | 228 | 66 | 917 | 1,735 | 797 | 1,763 | 1,750 | 487 | 1,548 | 1,359 | 1,439 | 529 |
| 2008 | 944 | 176 | 937 | 981 | 1,122 | 1,988 | 2,427 | 2,848 | 2,019 | 2,096 | 1,565 | 2,616 |
| 2009 | 1,654 | 2,109 | 1,529 | 1,643 | 1,030 | 1,330 | 1,073 | 1,179 | 1,018 | 1,928 | 589 | 788 |
| 2010 | 2,632 | 2,178 | 2,156 | 2,853 | 1,849 | 2,779 | 3,294 | 2,794 | 3,222 | 2,671 | 2,122 | 1,705 |
| 2011 | 2,005 | 1,368 | 688 | 2,235 | 2,862 | 1,026 | 2,015 | 1,642 | 1,641 | 2,339 | 1,633 | 1,533 |
| 2012 | 2,242 | 1,346 | 1,972 | 1,537 | 1,429 | 1,853 | 1,664 | 3,011 | 1,957 | 2,082 | 1,292 | 1,192 |
| 2013 | 951 | 1,330 | 795 | 1,041 | 1,233 | 1,877 | 2,517 | 1,964 | 1,080 | 1,900 | 1,108 | 1,735 |
| 2014 | 1,906 | 1,077 | 2,350 | 1,840 | 2,861 | 1,383 | 994 | 1,278 | 844 | 395 | 319 | 1,190 |
| 2015 | 2,177 | 1,219 | 538 | 926 | 1,050 | 593 | 1,747 | 1,414 | 1,029 | 968 | 524 | |
| 2016 | 1,640 | 320 | 1,482 | 1,559 | 1,096 | 1,514 | 636 | 297 | 1,066 | 965 | 1,179 | 910 |
| 2017 | 661 | 258 | 301 | 713 | 1,280 | 685 | 163 | 446 | 1,029 | 76 | ||
| 2018 | 3 | 924 | 1,801 | 759 | 2,170 | 1,666 | 1,016 | 322 | 961 | |||
| 2019 | 427 | 359 | 281 | 728 | 795 | 365 | 453 | 70 | 150 | 432 | ||
| 2020 | 637 | 839 | 640 | 536 | 16 | 178 | 320 | 292 | 473 | 668 | 500 | 621 |
| 2021 | 638 | 352 | 2 | 852 | 354 | 267 | 290 | 861 | 222 | 390 | ||
| 2022 | 280 | 125 | 1,286 | 717 | 86 | 306 | 297 | 346 | 73 | 180 | ||
| 2023 | 330 | 340 | 121 | 698 | 333 | 269 | 316 | 689 | 217 | 366 | ||
| - = No Data Reported; -- = Not Applicable; NA = Not Available; W = Withheld to avoid disclosure of individual company data. |
| Release Date: 3/29/2024 |
| Next Release Date: 4/30/2024 |