|
Download Data (XLS File) |
|
||||||||
|
||||||||
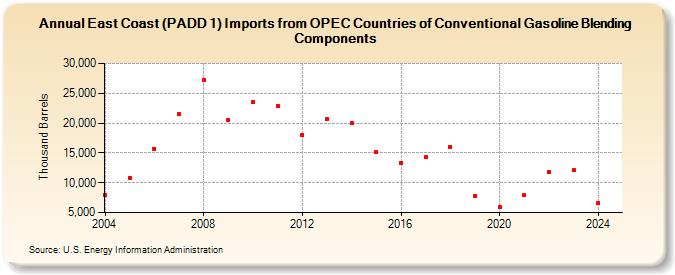
| East Coast (PADD 1) Imports from OPEC Countries of Conventional Gasoline Blending Components (Thousand Barrels) | ||||||||
| Decade | Year-0 | Year-1 | Year-2 | Year-3 | Year-4 | Year-5 | Year-6 | Year-7 | Year-8 | Year-9 |
|---|---|---|---|---|---|---|---|---|---|---|
| 2000's | 7,986 | 10,865 | 15,711 | 21,490 | 27,195 | 20,514 | ||||
| 2010's | 23,624 | 22,868 | 18,028 | 20,695 | 20,053 | 15,140 | 13,286 | 14,257 | 16,049 | 7,731 |
| 2020's | 5,937 | 7,889 | 11,781 | 12,145 |
| - = No Data Reported; -- = Not Applicable; NA = Not Available; W = Withheld to avoid disclosure of individual company data. |
| Release Date: 8/30/2024 |
| Next Release Date: 8/29/2025 |