|
Download Data (XLS File) |
|
||||||||
|
||||||||
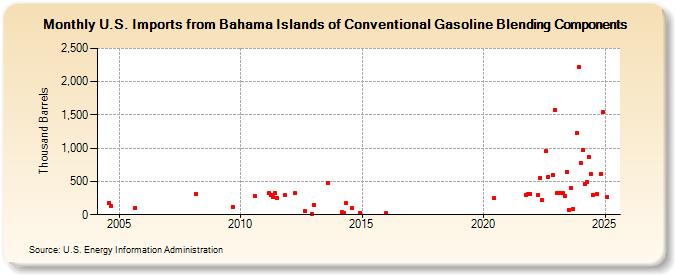
| U.S. Imports from Bahama Islands of Conventional Gasoline Blending Components (Thousand Barrels) | ||||||||
| Year | Jan | Feb | Mar | Apr | May | Jun | Jul | Aug | Sep | Oct | Nov | Dec |
|---|---|---|---|---|---|---|---|---|---|---|---|---|
| 2004 | 175 | 129 | ||||||||||
| 2005 | 107 | |||||||||||
| 2008 | 312 | |||||||||||
| 2009 | 123 | |||||||||||
| 2010 | 281 | |||||||||||
| 2011 | 320 | 302 | 265 | 323 | 250 | 290 | ||||||
| 2012 | 322 | 50 | 15 | |||||||||
| 2013 | 150 | 483 | ||||||||||
| 2014 | 38 | 26 | 170 | 96 | 27 | |||||||
| 2016 | 20 | |||||||||||
| 2020 | 248 | |||||||||||
| 2021 | 295 | 310 | 315 | |||||||||
| 2022 | 299 | 555 | 227 | 956 | 569 | 602 | 1,573 | |||||
| 2023 | 324 | 327 | 326 | 275 | 646 | 75 | 401 | 86 | 1,226 | 2,225 | ||
| 2024 | 782 | |||||||||||
| - = No Data Reported; -- = Not Applicable; NA = Not Available; W = Withheld to avoid disclosure of individual company data. |
| Release Date: 3/29/2024 |
| Next Release Date: 4/30/2024 |