|
Download Data (XLS File) |
|
||||||||
|
||||||||
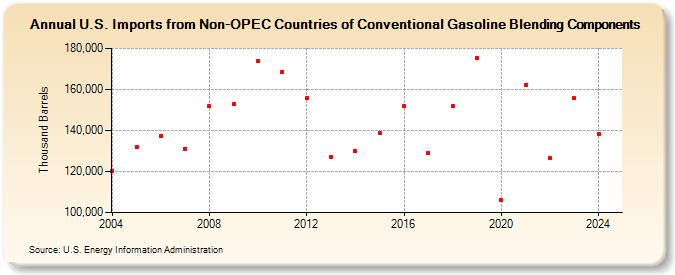
| U.S. Imports from Non-OPEC Countries of Conventional Gasoline Blending Components (Thousand Barrels) | ||||||||
| Decade | Year-0 | Year-1 | Year-2 | Year-3 | Year-4 | Year-5 | Year-6 | Year-7 | Year-8 | Year-9 |
|---|---|---|---|---|---|---|---|---|---|---|
| 2000's | 120,312 | 131,732 | 137,335 | 130,972 | 151,862 | 152,667 | ||||
| 2010's | 173,849 | 168,615 | 155,673 | 127,245 | 129,822 | 138,802 | 151,798 | 129,034 | 152,082 | 175,527 |
| 2020's | 106,011 | 162,177 | 126,455 | 155,664 |
| - = No Data Reported; -- = Not Applicable; NA = Not Available; W = Withheld to avoid disclosure of individual company data. |
| Release Date: 3/29/2024 |
| Next Release Date: 8/30/2024 |