|
Download Data (XLS File) |
|
||||||||
|
||||||||
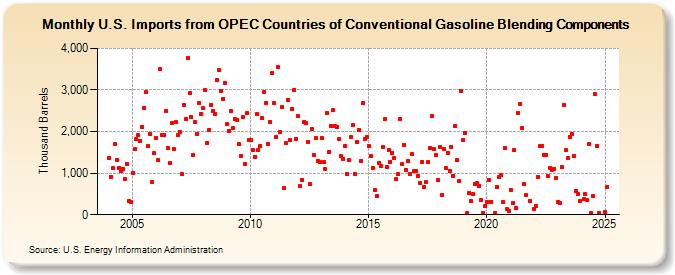
| U.S. Imports from OPEC Countries of Conventional Gasoline Blending Components (Thousand Barrels) | ||||||||
| Year | Jan | Feb | Mar | Apr | May | Jun | Jul | Aug | Sep | Oct | Nov | Dec |
|---|---|---|---|---|---|---|---|---|---|---|---|---|
| 2004 | 1,374 | 919 | 1,115 | 1,695 | 1,317 | 1,129 | 1,054 | 1,101 | 868 | 1,222 | 334 | 309 |
| 2005 | 1,011 | 1,573 | 1,825 | 1,915 | 1,784 | 2,112 | 2,571 | 2,948 | 1,642 | 1,945 | 793 | 1,477 |
| 2006 | 1,841 | 1,313 | 3,507 | 1,924 | 1,925 | 2,496 | 1,616 | 1,236 | 2,195 | 1,572 | 2,223 | 1,916 |
| 2007 | 1,997 | 979 | 2,636 | 2,296 | 3,775 | 2,926 | 2,338 | 1,445 | 2,222 | 1,949 | 2,678 | 2,417 |
| 2008 | 2,557 | 2,998 | 1,736 | 2,046 | 2,638 | 2,495 | 2,429 | 3,241 | 3,472 | 2,980 | 2,788 | 3,157 |
| 2009 | 2,175 | 2,018 | 2,490 | 2,081 | 2,292 | 2,288 | 1,702 | 1,408 | 2,344 | 1,217 | 2,450 | 1,787 |
| 2010 | 1,790 | 1,561 | 1,389 | 2,430 | 1,557 | 1,657 | 2,317 | 2,960 | 2,692 | 1,710 | 2,226 | 3,412 |
| 2011 | 2,676 | 1,875 | 3,545 | 1,989 | 2,600 | 636 | 1,723 | 2,768 | 1,793 | 2,554 | 3,001 | 1,822 |
| 2012 | 2,386 | 699 | 842 | 2,218 | 2,200 | 1,749 | 735 | 2,067 | 1,447 | 1,844 | 1,302 | 1,272 |
| 2013 | 1,841 | 1,262 | 1,102 | 2,446 | 1,514 | 2,145 | 2,518 | 2,124 | 2,112 | 1,828 | 1,406 | 1,337 |
| 2014 | 1,652 | 981 | 1,309 | 1,858 | 2,155 | 975 | 1,758 | 2,048 | 1,297 | 2,691 | 1,830 | 1,876 |
| 2015 | 1,656 | 1,402 | 1,130 | 606 | 455 | 1,245 | 1,165 | 1,617 | 2,294 | 1,148 | 1,565 | 1,278 |
| 2016 | 1,487 | 1,364 | 852 | 974 | 2,306 | 1,218 | 1,683 | 1,087 | 1,292 | 986 | 1,450 | 1,062 |
| 2017 | 1,053 | 928 | 773 | 1,273 | 656 | 782 | 1,258 | 1,600 | 2,368 | 1,592 | 1,429 | 834 |
| 2018 | 1,624 | 486 | 1,579 | 1,116 | 1,491 | 1,056 | 1,617 | 941 | 2,141 | 1,309 | 813 | 2,966 |
| 2019 | 1,807 | 1,972 | 42 | 515 | 319 | 492 | 730 | 754 | 697 | 351 | 52 | 205 |
| 2020 | 308 | 837 | 316 | 52 | 660 | 906 | 956 | 309 | 1,597 | 130 | 100 | |
| 2021 | 601 | 282 | 1,552 | 164 | 2,456 | 2,662 | 2,086 | 744 | 464 | 325 | ||
| 2022 | 135 | 200 | 919 | 1,651 | 1,664 | 1,440 | 1,446 | 940 | 1,135 | 1,083 | 1,106 | 886 |
| 2023 | 316 | 275 | 1,143 | 2,639 | 1,546 | 1,354 | 1,874 | 1,951 | 1,415 | 576 | 489 | 324 |
| - = No Data Reported; -- = Not Applicable; NA = Not Available; W = Withheld to avoid disclosure of individual company data. |
| Release Date: 3/29/2024 |
| Next Release Date: 4/30/2024 |