|
Download Data (XLS File) |
|
||||||||
|
||||||||
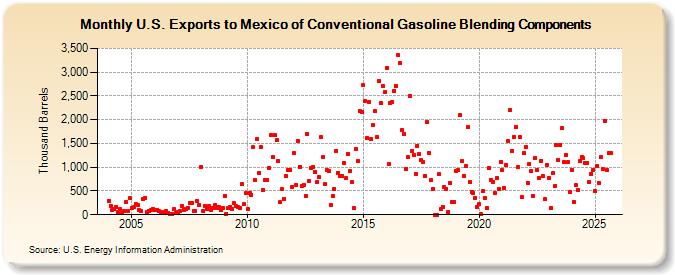
| U.S. Exports to Mexico of Conventional Gasoline Blending Components (Thousand Barrels) | ||||||||
| Year | Jan | Feb | Mar | Apr | May | Jun | Jul | Aug | Sep | Oct | Nov | Dec |
|---|---|---|---|---|---|---|---|---|---|---|---|---|
| 2004 | 298 | 193 | 104 | 113 | 160 | 66 | 115 | 33 | 85 | 276 | 87 | 342 |
| 2005 | 145 | 154 | 230 | 201 | 98 | 69 | 322 | 347 | 49 | 83 | 106 | 128 |
| 2006 | 100 | 107 | 83 | 62 | 26 | 66 | 82 | 38 | 17 | 17 | 110 | 40 |
| 2007 | 48 | 72 | 183 | 105 | 124 | 151 | 250 | 248 | 73 | 78 | 285 | 205 |
| 2008 | 1,006 | 70 | 183 | 110 | 177 | 109 | 144 | 196 | 134 | 159 | 91 | 147 |
| 2009 | 394 | 23 | 141 | 165 | 127 | 238 | 180 | 158 | 140 | 643 | 219 | 455 |
| 2010 | 123 | 464 | 423 | 1,418 | 737 | 1,595 | 885 | 1,421 | 517 | 730 | 730 | 981 |
| 2011 | 1,678 | 1,212 | 1,675 | 1,562 | 1,128 | 260 | 531 | 338 | 817 | 951 | 949 | 585 |
| 2012 | 1,289 | 628 | 1,559 | 1,009 | 610 | 635 | 397 | 1,708 | 706 | 980 | 1,007 | 909 |
| 2013 | 687 | 784 | 1,625 | 1,211 | 650 | 939 | 914 | 208 | 392 | 550 | 1,347 | 885 |
| 2014 | 820 | 818 | 1,095 | 766 | 1,275 | 916 | 678 | 140 | 1,376 | 1,128 | 2,174 | 2,168 |
| 2015 | 2,721 | 2,401 | 1,616 | 2,378 | 1,589 | 1,878 | 2,180 | 1,637 | 2,817 | 2,341 | 2,699 | 2,574 |
| 2016 | 3,093 | 1,058 | 2,347 | 2,365 | 2,609 | 2,704 | 3,359 | 3,189 | 1,774 | 1,692 | 965 | 1,219 |
| 2017 | 2,493 | 1,340 | 1,259 | 857 | 1,448 | 1,280 | 1,149 | 1,113 | 818 | 1,942 | 1,309 | 720 |
| 2018 | 531 | 2 | 3 | 849 | 114 | 170 | 589 | 544 | 64 | 668 | 278 | 275 |
| 2019 | 930 | 933 | 2,101 | 1,135 | 820 | 1,028 | 1,839 | 687 | 477 | 455 | 357 | 161 |
| 2020 | 216 | 6 | 489 | 349 | 148 | 981 | 731 | 696 | 455 | 770 | 545 | 1,108 |
| 2021 | 931 | 556 | 1,042 | 1,546 | 2,199 | 1,342 | 1,639 | 1,846 | 998 | 1,627 | 367 | 1,300 |
| 2022 | 1,432 | 668 | 1,071 | 915 | 396 | 1,202 | 940 | 769 | 1,137 | 809 | 323 | 1,053 |
| 2023 | 703 | 83 | 816 | 441 | 1,380 | 1,152 | 1,450 | 1,819 | 1,107 | 1,258 | 1,107 | 460 |
| 2024 | 1,215 | 266 | 347 | 511 | ||||||||
| - = No Data Reported; -- = Not Applicable; NA = Not Available; W = Withheld to avoid disclosure of individual company data. |
| Release Date: 6/28/2024 |
| Next Release Date: 7/31/2024 |