|
Download Data (XLS File) |
|
||||||||
|
||||||||
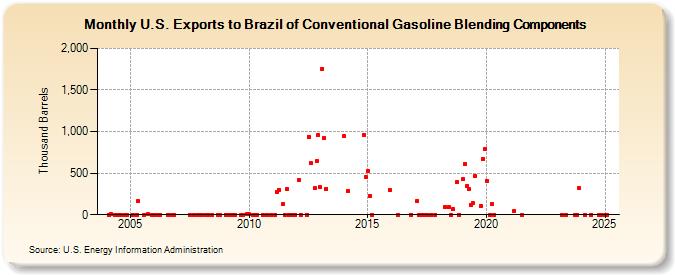
| U.S. Exports to Brazil of Conventional Gasoline Blending Components (Thousand Barrels) | ||||||||
| Year | Jan | Feb | Mar | Apr | May | Jun | Jul | Aug | Sep | Oct | Nov | Dec |
|---|---|---|---|---|---|---|---|---|---|---|---|---|
| 2004 | 0 | 6 | 0 | 0 | 0 | 0 | 1 | 0 | ||||
| 2005 | 2 | 1 | 160 | 1 | 3 | 0 | ||||||
| 2006 | 0 | 1 | 0 | 0 | 0 | 0 | ||||||
| 2007 | 0 | 0 | 0 | 0 | ||||||||
| 2008 | 1 | 1 | 0 | 0 | 0 | 0 | ||||||
| 2009 | 0 | 0 | 0 | 0 | 0 | 0 | 0 | 0 | 9 | |||
| 2010 | 7 | 1 | 0 | 2 | 0 | 0 | 0 | |||||
| 2011 | 0 | 278 | 301 | 124 | 0 | 315 | 0 | 0 | 0 | 1 | ||
| 2012 | 421 | 0 | 0 | 940 | 620 | 323 | 642 | 962 | ||||
| 2013 | 330 | 1,758 | 921 | 315 | ||||||||
| 2014 | 943 | 284 | 962 | 454 | ||||||||
| 2015 | 531 | 230 | 0 | 298 | ||||||||
| 2016 | 0 | 0 | ||||||||||
| 2017 | 163 | 0 | 0 | 0 | 0 | 0 | 0 | 0 | ||||
| 2018 | 90 | 90 | 0 | 63 | 391 | 0 | ||||||
| 2019 | 424 | 608 | 348 | 310 | 114 | 138 | 461 | 103 | 665 | 786 | ||
| 2020 | 406 | 0 | 123 | 0 | ||||||||
| 2021 | 42 | 0 | ||||||||||
| 2023 | 0 | 0 | 0 | 0 | 317 | |||||||
| - = No Data Reported; -- = Not Applicable; NA = Not Available; W = Withheld to avoid disclosure of individual company data. |
| Release Date: 3/29/2024 |
| Next Release Date: 4/30/2024 |