|
Download Data (XLS File) |
|
||||||||
|
||||||||
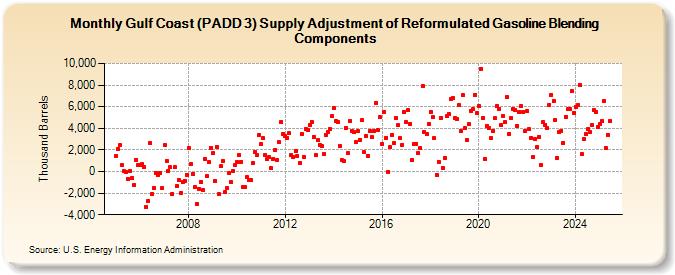
| Gulf Coast (PADD 3) Supply Adjustment of Reformulated Gasoline Blending Components (Thousand Barrels) | ||||||||
| Year | Jan | Feb | Mar | Apr | May | Jun | Jul | Aug | Sep | Oct | Nov | Dec |
|---|---|---|---|---|---|---|---|---|---|---|---|---|
| 2005 | 1,401 | 2,107 | 2,428 | 556 | 45 | -50 | -730 | 84 | -571 | -1,266 | 1,091 | 567 |
| 2006 | 593 | 678 | 395 | -3,272 | -2,735 | 2,625 | -2,095 | -1,522 | -156 | -278 | -137 | -1,554 |
| 2007 | 2,420 | 1,006 | 81 | 390 | -2,089 | 389 | -1,348 | -778 | -2,022 | -1,009 | -856 | -295 |
| 2008 | 2,195 | 683 | -198 | -1,449 | -2,973 | -1,590 | -956 | -1,692 | 1,135 | -429 | 835 | 2,209 |
| 2009 | 1,679 | -843 | 2,278 | -2,128 | 478 | 978 | -1,935 | -1,510 | -164 | -982 | 27 | 609 |
| 2010 | 862 | 1,495 | 925 | -1,466 | -1,447 | -537 | -761 | -792 | 807 | 1,807 | 1,486 | 3,395 |
| 2011 | 2,544 | 3,073 | 1,495 | 1,120 | 1,310 | 286 | 1,185 | 2,029 | 1,056 | 2,731 | 4,598 | 3,497 |
| 2012 | 3,305 | 3,115 | 3,528 | 1,503 | 1,339 | 1,868 | 1,425 | 827 | 3,515 | 1,350 | 3,923 | 3,803 |
| 2013 | 4,297 | 4,605 | 3,224 | 1,515 | 2,889 | 2,466 | 2,348 | 1,622 | 3,402 | 3,661 | 3,938 | 5,133 |
| 2014 | 5,871 | 4,687 | 4,620 | 2,331 | 1,060 | 963 | 4,030 | 1,708 | 4,713 | 3,704 | 3,634 | 2,744 |
| 2015 | 3,717 | 2,955 | 4,761 | 1,768 | 3,259 | 1,461 | 3,709 | 3,157 | 3,773 | 6,355 | 3,809 | 5,013 |
| 2016 | 2,580 | 5,533 | 3,126 | -29 | 2,235 | 3,389 | 2,619 | 4,963 | 4,267 | 3,100 | 2,478 | 5,501 |
| 2017 | 4,540 | 5,653 | 4,418 | 1,074 | 2,561 | 2,558 | 1,703 | 2,155 | 7,887 | 3,620 | 3,498 | 4,380 |
| 2018 | 5,529 | 5,003 | 3,062 | -292 | 901 | 4,970 | 358 | 1,235 | 5,114 | 5,363 | 6,715 | 6,831 |
| 2019 | 4,929 | 4,832 | 6,149 | 3,769 | 7,055 | 4,011 | 2,910 | 4,368 | 5,585 | 5,751 | 7,084 | 5,410 |
| 2020 | 6,021 | 9,518 | 4,946 | 1,164 | 4,222 | 4,016 | 3,068 | 3,709 | 4,910 | 6,047 | 5,796 | 4,266 |
| 2021 | 5,163 | 4,552 | 6,883 | 3,481 | 4,977 | 5,777 | 5,738 | 4,248 | 5,544 | 6,048 | 5,465 | 3,771 |
| 2022 | 5,587 | 3,905 | 3,135 | 1,351 | 3,014 | 2,252 | 3,197 | 592 | 4,570 | 4,345 | 3,988 | 6,192 |
| 2023 | 7,153 | 6,453 | 5,048 | 983 | 3,656 | 3,819 | 3,348 | 4,109 | 5,890 | 6,404 | 7,775 | 6,094 |
| 2024 | 5,222 | 5,990 | 7,889 | 1,720 | ||||||||
| - = No Data Reported; -- = Not Applicable; NA = Not Available; W = Withheld to avoid disclosure of individual company data. |
| Release Date: 6/28/2024 |
| Next Release Date: 7/31/2024 |