|
Download Data (XLS File) |
|
||||||||
|
||||||||
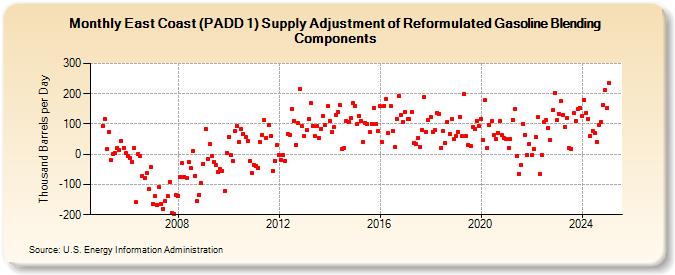
| East Coast (PADD 1) Supply Adjustment of Reformulated Gasoline Blending Components (Thousand Barrels per Day) | ||||||||
| Year | Jan | Feb | Mar | Apr | May | Jun | Jul | Aug | Sep | Oct | Nov | Dec |
|---|---|---|---|---|---|---|---|---|---|---|---|---|
| 2005 | 92 | 118 | 16 | 75 | -18 | 0 | 4 | 20 | 13 | 43 | 22 | 4 |
| 2006 | -5 | -12 | -25 | 19 | -159 | 1 | -6 | -71 | -78 | -63 | -114 | -43 |
| 2007 | -164 | -139 | -168 | -109 | -163 | -181 | -155 | -139 | -91 | -195 | -198 | -135 |
| 2008 | -137 | -74 | -30 | -75 | -77 | -27 | -47 | 10 | -72 | -156 | -134 | -96 |
| 2009 | -31 | 85 | -16 | 34 | -7 | -26 | -37 | -58 | -50 | -54 | -122 | 4 |
| 2010 | 58 | -3 | -21 | 76 | 93 | 40 | 84 | 67 | 56 | 43 | -22 | -62 |
| 2011 | -34 | -40 | -44 | 41 | 65 | 113 | 55 | 95 | 59 | -54 | -23 | 30 |
| 2012 | -2 | -20 | -4 | -22 | 67 | 62 | 151 | 110 | 30 | 103 | 215 | 93 |
| 2013 | 61 | 79 | 117 | 168 | 94 | 59 | 92 | 54 | 85 | 127 | 95 | 159 |
| 2014 | 110 | 72 | 90 | 130 | 139 | 162 | 16 | 22 | 110 | 106 | 120 | 170 |
| 2015 | 161 | 101 | 128 | 111 | 39 | 103 | 99 | 72 | 101 | 154 | 101 | 77 |
| 2016 | 158 | 40 | 161 | 183 | 69 | 159 | 78 | 24 | 117 | 193 | 129 | 106 |
| 2017 | 141 | 115 | 115 | 141 | 38 | 33 | 53 | 24 | 81 | 189 | 73 | 114 |
| 2018 | 123 | 75 | 80 | 137 | 133 | 19 | 77 | 37 | 107 | 67 | 118 | 49 |
| 2019 | 61 | 75 | 124 | 59 | 198 | 61 | 32 | 27 | 90 | 84 | 111 | 92 |
| 2020 | 118 | 46 | 178 | 20 | 98 | 110 | 63 | 49 | 71 | 109 | 62 | 54 |
| 2021 | 50 | 21 | 50 | 114 | 150 | -6 | -64 | -37 | 101 | 65 | -3 | 34 |
| 2022 | -3 | 16 | 58 | 122 | -66 | -1 | 107 | 113 | 87 | 47 | 145 | 203 |
| 2023 | 178 | 150 | 150 | 136 | 96 | 120 | 20 | 17 | 135 | 111 | 148 | 149 |
| 2024 | 128 | |||||||||||
| - = No Data Reported; -- = Not Applicable; NA = Not Available; W = Withheld to avoid disclosure of individual company data. |
| Release Date: 3/29/2024 |
| Next Release Date: 4/30/2024 |