|
Download Data (XLS File) |
|
||||||||
|
||||||||
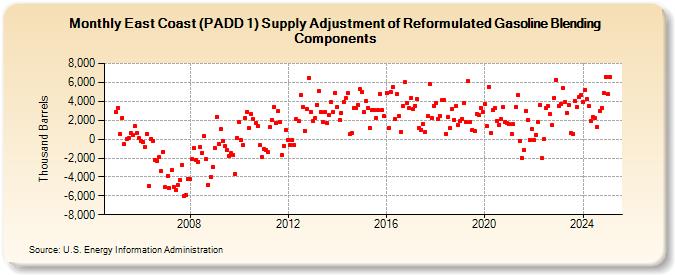
| East Coast (PADD 1) Supply Adjustment of Reformulated Gasoline Blending Components (Thousand Barrels) | ||||||||
| Year | Jan | Feb | Mar | Apr | May | Jun | Jul | Aug | Sep | Oct | Nov | Dec |
|---|---|---|---|---|---|---|---|---|---|---|---|---|
| 2005 | 2,865 | 3,302 | 497 | 2,237 | -560 | -1 | 137 | 631 | 401 | 1,333 | 663 | 110 |
| 2006 | -159 | -322 | -785 | 562 | -4,920 | 28 | -176 | -2,203 | -2,332 | -1,944 | -3,419 | -1,331 |
| 2007 | -5,099 | -3,887 | -5,214 | -3,284 | -5,042 | -5,420 | -4,814 | -4,305 | -2,716 | -6,058 | -5,929 | -4,198 |
| 2008 | -4,252 | -2,153 | -919 | -2,262 | -2,384 | -803 | -1,467 | 309 | -2,150 | -4,841 | -4,031 | -2,965 |
| 2009 | -947 | 2,369 | -503 | 1,028 | -218 | -780 | -1,162 | -1,795 | -1,487 | -1,686 | -3,672 | 123 |
| 2010 | 1,783 | -72 | -644 | 2,275 | 2,898 | 1,186 | 2,613 | 2,090 | 1,669 | 1,339 | -665 | -1,916 |
| 2011 | -1,039 | -1,120 | -1,375 | 1,241 | 2,026 | 3,393 | 1,709 | 2,934 | 1,761 | -1,677 | -684 | 945 |
| 2012 | -58 | -583 | -133 | -651 | 2,087 | 1,868 | 4,691 | 3,407 | 896 | 3,205 | 6,460 | 2,869 |
| 2013 | 1,903 | 2,221 | 3,613 | 5,053 | 2,905 | 1,757 | 2,855 | 1,671 | 2,543 | 3,925 | 2,861 | 4,914 |
| 2014 | 3,422 | 2,014 | 2,794 | 3,906 | 4,301 | 4,856 | 506 | 675 | 3,301 | 3,298 | 3,614 | 5,268 |
| 2015 | 4,982 | 2,825 | 3,982 | 3,324 | 1,222 | 3,087 | 3,056 | 2,247 | 3,029 | 4,771 | 3,034 | 2,398 |
| 2016 | 4,908 | 1,171 | 5,004 | 5,479 | 2,125 | 4,774 | 2,405 | 754 | 3,518 | 5,991 | 3,862 | 3,276 |
| 2017 | 4,381 | 3,221 | 3,554 | 4,228 | 1,174 | 990 | 1,637 | 734 | 2,432 | 5,865 | 2,189 | 3,533 |
| 2018 | 3,825 | 2,102 | 2,480 | 4,102 | 4,132 | 574 | 2,375 | 1,150 | 3,201 | 2,072 | 3,529 | 1,507 |
| 2019 | 1,881 | 2,101 | 3,829 | 1,779 | 6,146 | 1,843 | 997 | 840 | 2,697 | 2,598 | 3,337 | 2,861 |
| 2020 | 3,673 | 1,346 | 5,526 | 601 | 3,041 | 3,293 | 1,957 | 1,526 | 2,137 | 3,364 | 1,859 | 1,664 |
| 2021 | 1,565 | 576 | 1,546 | 3,406 | 4,658 | -194 | -1,975 | -1,138 | 3,016 | 2,019 | -94 | 1,061 |
| 2022 | -90 | 449 | 1,811 | 3,651 | -2,034 | -24 | 3,314 | 3,488 | 2,608 | 1,471 | 4,355 | 6,302 |
| 2023 | 5,506 | 4,191 | 4,664 | 4,094 | 2,969 | 3,599 | 619 | 530 | 4,039 | 3,440 | 4,434 | 4,611 |
| 2024 | 3,963 | |||||||||||
| - = No Data Reported; -- = Not Applicable; NA = Not Available; W = Withheld to avoid disclosure of individual company data. |
| Release Date: 3/29/2024 |
| Next Release Date: 4/30/2024 |