|
Download Data (XLS File) |
|
||||||||
|
||||||||
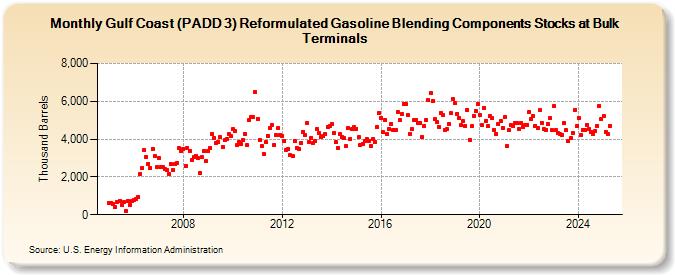
| Gulf Coast (PADD 3) Reformulated Gasoline Blending Components Stocks at Bulk Terminals (Thousand Barrels) | ||||||||
| Year | Jan | Feb | Mar | Apr | May | Jun | Jul | Aug | Sep | Oct | Nov | Dec |
|---|---|---|---|---|---|---|---|---|---|---|---|---|
| 2005 | 630 | 631 | 564 | 387 | 693 | 745 | 526 | 647 | 187 | 739 | 528 | 703 |
| 2006 | 780 | 832 | 926 | 2,145 | 2,491 | 3,434 | 3,060 | 2,709 | 2,481 | 3,494 | 3,089 | 2,502 |
| 2007 | 3,005 | 2,508 | 2,516 | 2,440 | 2,343 | 2,167 | 2,668 | 2,356 | 2,680 | 2,750 | 3,504 | 3,380 |
| 2008 | 3,475 | 2,564 | 3,539 | 3,393 | 2,899 | 3,039 | 3,117 | 2,980 | 2,191 | 3,049 | 3,369 | 2,830 |
| 2009 | 3,366 | 3,533 | 4,285 | 4,063 | 3,794 | 3,859 | 4,090 | 3,604 | 3,934 | 4,021 | 4,280 | 4,144 |
| 2010 | 4,510 | 4,416 | 3,684 | 3,831 | 3,725 | 3,953 | 4,278 | 3,685 | 5,000 | 5,154 | 5,146 | 6,486 |
| 2011 | 5,081 | 3,952 | 3,624 | 3,220 | 3,842 | 4,178 | 4,566 | 4,771 | 3,702 | 4,195 | 4,576 | 4,218 |
| 2012 | 4,187 | 3,894 | 3,436 | 3,470 | 3,138 | 3,102 | 3,919 | 3,547 | 3,477 | 3,793 | 4,391 | 4,222 |
| 2013 | 4,870 | 3,854 | 4,083 | 3,786 | 3,909 | 4,530 | 4,304 | 4,115 | 4,176 | 4,255 | 4,643 | 4,691 |
| 2014 | 4,810 | 4,329 | 3,829 | 3,543 | 4,259 | 4,125 | 4,062 | 3,616 | 4,580 | 4,010 | 4,523 | 4,616 |
| 2015 | 4,553 | 4,086 | 3,705 | 3,757 | 3,875 | 3,996 | 3,917 | 3,651 | 3,997 | 3,861 | 4,651 | 5,388 |
| 2016 | 5,129 | 4,350 | 5,017 | 4,249 | 4,551 | 4,799 | 4,487 | 4,505 | 5,434 | 5,008 | 5,336 | 5,881 |
| 2017 | 5,851 | 5,270 | 4,285 | 4,539 | 4,996 | 5,026 | 4,873 | 4,874 | 4,112 | 4,687 | 5,018 | 6,080 |
| 2018 | 6,417 | 6,027 | 5,048 | 4,917 | 4,649 | 5,402 | 5,252 | 4,500 | 4,508 | 4,820 | 5,363 | 6,109 |
| 2019 | 5,885 | 5,343 | 5,115 | 4,724 | 4,935 | 4,702 | 5,549 | 3,977 | 4,670 | 5,223 | 5,477 | 5,859 |
| 2020 | 5,258 | 4,737 | 5,656 | 4,975 | 4,682 | 5,214 | 5,100 | 4,493 | 4,292 | 4,820 | 4,947 | 4,596 |
| 2021 | 5,144 | 3,621 | 4,460 | 4,724 | 4,715 | 4,844 | 4,851 | 4,543 | 4,872 | 4,646 | 4,764 | 4,764 |
| 2022 | 5,443 | 5,049 | 5,245 | 4,699 | 4,563 | 5,513 | 4,870 | 4,513 | 4,497 | 4,805 | 5,107 | 4,476 |
| 2023 | 5,718 | 4,368 | 4,275 | 4,125 | 4,128 | 4,780 | 5,109 | 3,925 | 3,991 | 4,349 | 5,556 | 5,251 |
| 2024 | 5,129 | 4,201 | 4,488 | 4,488 | ||||||||
| - = No Data Reported; -- = Not Applicable; NA = Not Available; W = Withheld to avoid disclosure of individual company data. |
| Release Date: 6/28/2024 |
| Next Release Date: 7/31/2024 |