|
Download Data (XLS File) |
|
||||||||
|
||||||||
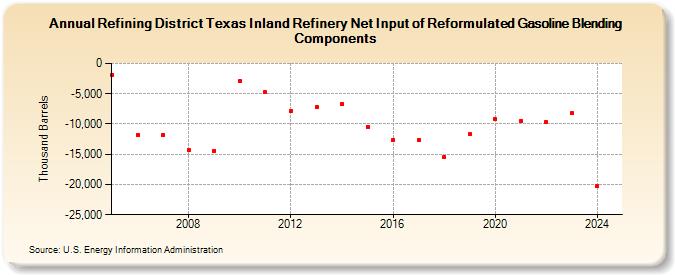
| Refining District Texas Inland Refinery Net Input of Reformulated Gasoline Blending Components (Thousand Barrels) | ||||||||
| Decade | Year-0 | Year-1 | Year-2 | Year-3 | Year-4 | Year-5 | Year-6 | Year-7 | Year-8 | Year-9 |
|---|---|---|---|---|---|---|---|---|---|---|
| 2000's | -1,883 | -11,819 | -11,755 | -14,262 | -14,408 | |||||
| 2010's | -2,921 | -4,790 | -7,852 | -7,156 | -6,650 | -10,440 | -12,710 | -12,666 | -15,520 | -11,719 |
| 2020's | -9,218 | -9,493 | -9,740 | -8,231 |
| - = No Data Reported; -- = Not Applicable; NA = Not Available; W = Withheld to avoid disclosure of individual company data. |
| Release Date: 8/30/2024 |
| Next Release Date: 8/29/2025 |