|
Download Data (XLS File) |
|
||||||||
|
||||||||
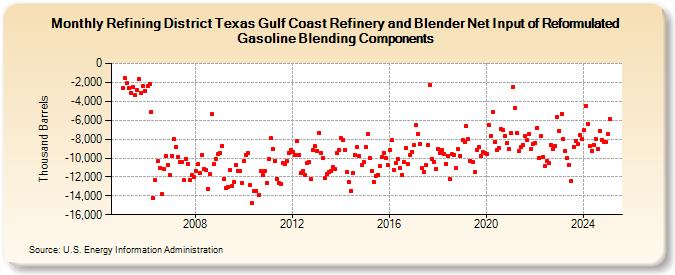
| Refining District Texas Gulf Coast Refinery and Blender Net Input of Reformulated Gasoline Blending Components (Thousand Barrels) | ||||||||
| Year | Jan | Feb | Mar | Apr | May | Jun | Jul | Aug | Sep | Oct | Nov | Dec |
|---|---|---|---|---|---|---|---|---|---|---|---|---|
| 2005 | -2,609 | -1,586 | -2,079 | -2,599 | -3,078 | -2,505 | -3,320 | -2,841 | -1,683 | -3,100 | -2,422 | -2,872 |
| 2006 | -2,425 | -2,192 | -5,083 | -14,282 | -12,370 | -10,349 | -11,093 | -13,801 | -11,124 | -9,809 | -10,733 | -11,808 |
| 2007 | -9,740 | -7,983 | -8,822 | -9,922 | -10,400 | -10,399 | -12,368 | -10,095 | -10,607 | -12,293 | -11,850 | -12,015 |
| 2008 | -11,387 | -10,681 | -11,636 | -9,632 | -11,175 | -11,281 | -13,260 | -11,725 | -5,392 | -10,651 | -10,154 | -9,582 |
| 2009 | -9,474 | -8,696 | -12,210 | -13,221 | -13,106 | -11,225 | -12,921 | -12,525 | -10,716 | -11,353 | -11,349 | -12,668 |
| 2010 | -10,305 | -9,702 | -9,445 | -12,894 | -14,792 | -13,536 | -13,460 | -13,925 | -11,407 | -11,819 | -11,365 | -12,640 |
| 2011 | -10,074 | -7,913 | -9,026 | -10,294 | -12,169 | -12,690 | -12,701 | -10,520 | -10,597 | -10,296 | -9,430 | -9,149 |
| 2012 | -9,394 | -9,633 | -8,240 | -9,644 | -11,545 | -11,409 | -11,840 | -10,527 | -10,456 | -12,261 | -9,169 | -8,762 |
| 2013 | -9,244 | -7,322 | -9,429 | -9,986 | -12,163 | -11,734 | -11,475 | -11,346 | -10,992 | -11,187 | -9,521 | -9,178 |
| 2014 | -7,913 | -8,101 | -9,153 | -11,502 | -12,545 | -13,441 | -11,537 | -9,687 | -8,885 | -9,837 | -10,751 | -10,402 |
| 2015 | -8,880 | -7,462 | -9,954 | -11,330 | -12,511 | -11,905 | -11,785 | -10,885 | -9,901 | -9,418 | -9,948 | -10,769 |
| 2016 | -9,163 | -8,146 | -11,220 | -10,548 | -10,150 | -11,026 | -11,812 | -10,428 | -8,917 | -10,662 | -9,680 | -9,327 |
| 2017 | -8,652 | -6,495 | -7,439 | -8,483 | -11,043 | -11,458 | -10,756 | -8,677 | -2,318 | -10,053 | -10,399 | -11,126 |
| 2018 | -9,005 | -9,486 | -9,131 | -9,614 | -10,632 | -9,806 | -12,243 | -9,626 | -9,643 | -11,099 | -9,086 | -9,821 |
| 2019 | -8,122 | -8,353 | -6,642 | -8,027 | -10,277 | -10,462 | -11,533 | -9,109 | -8,887 | -9,834 | -9,360 | -9,498 |
| 2020 | -9,538 | -6,508 | -7,686 | -5,116 | -8,288 | -9,203 | -8,992 | -6,960 | -7,059 | -7,653 | -8,454 | -9,096 |
| 2021 | -7,393 | -2,532 | -4,666 | -7,401 | -9,311 | -8,835 | -8,637 | -7,723 | -8,049 | -7,449 | -9,026 | -8,477 |
| 2022 | -8,442 | -6,775 | -10,018 | -7,717 | -9,929 | -10,885 | -10,327 | -10,517 | -8,585 | -9,024 | -8,746 | -5,701 |
| 2023 | -7,215 | -5,311 | -7,990 | -9,322 | -10,064 | -10,589 | -12,428 | -8,950 | -7,983 | -8,634 | -7,666 | -7,916 |
| 2024 | -7,049 | |||||||||||
| - = No Data Reported; -- = Not Applicable; NA = Not Available; W = Withheld to avoid disclosure of individual company data. |
| Release Date: 3/29/2024 |
| Next Release Date: 4/30/2024 |