|
Download Data (XLS File) |
|
||||||||
|
||||||||
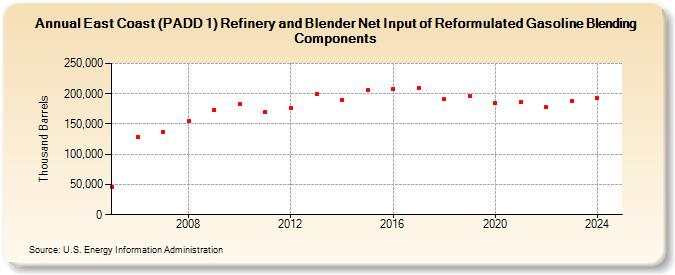
| East Coast (PADD 1) Refinery and Blender Net Input of Reformulated Gasoline Blending Components (Thousand Barrels) | ||||||||
| Decade | Year-0 | Year-1 | Year-2 | Year-3 | Year-4 | Year-5 | Year-6 | Year-7 | Year-8 | Year-9 |
|---|---|---|---|---|---|---|---|---|---|---|
| 2000's | 46,120 | 129,255 | 136,855 | 154,997 | 173,529 | |||||
| 2010's | 182,993 | 169,837 | 175,769 | 199,748 | 189,232 | 205,418 | 208,343 | 209,079 | 190,698 | 195,435 |
| 2020's | 184,393 | 186,485 | 177,985 | 187,051 |
| - = No Data Reported; -- = Not Applicable; NA = Not Available; W = Withheld to avoid disclosure of individual company data. |
| Release Date: 6/28/2024 |
| Next Release Date: 8/30/2024 |