|
Download Data (XLS File) |
|
||||||||
|
||||||||
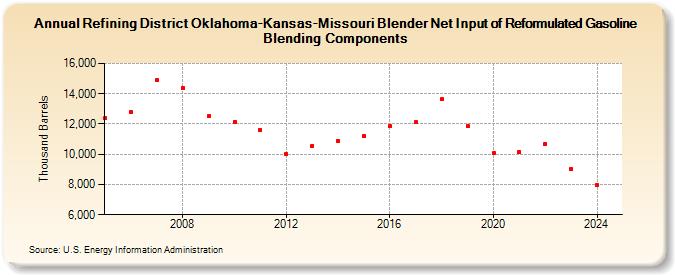
| Refining District Oklahoma-Kansas-Missouri Blender Net Input of Reformulated Gasoline Blending Components (Thousand Barrels) | ||||||||
| Decade | Year-0 | Year-1 | Year-2 | Year-3 | Year-4 | Year-5 | Year-6 | Year-7 | Year-8 | Year-9 |
|---|---|---|---|---|---|---|---|---|---|---|
| 2000's | 12,372 | 12,759 | 14,891 | 14,410 | 12,506 | |||||
| 2010's | 12,135 | 11,599 | 9,999 | 10,548 | 10,876 | 11,189 | 11,846 | 12,128 | 13,634 | 11,846 |
| 2020's | 10,060 | 10,133 | 10,676 | 9,004 |
| - = No Data Reported; -- = Not Applicable; NA = Not Available; W = Withheld to avoid disclosure of individual company data. |
| Release Date: 3/29/2024 |
| Next Release Date: 8/30/2024 |