|
Download Data (XLS File) |
|
||||||||
|
||||||||
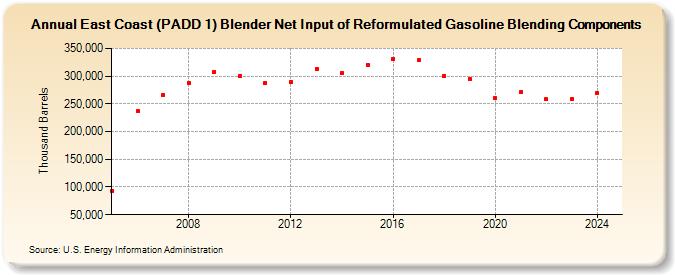
| East Coast (PADD 1) Blender Net Input of Reformulated Gasoline Blending Components (Thousand Barrels) | ||||||||
| Decade | Year-0 | Year-1 | Year-2 | Year-3 | Year-4 | Year-5 | Year-6 | Year-7 | Year-8 | Year-9 |
|---|---|---|---|---|---|---|---|---|---|---|
| 2000's | 93,132 | 236,711 | 266,775 | 287,436 | 307,993 | |||||
| 2010's | 300,100 | 288,466 | 289,547 | 312,920 | 305,825 | 320,905 | 331,046 | 328,369 | 300,740 | 294,009 |
| 2020's | 260,079 | 270,816 | 258,013 | 258,720 |
| - = No Data Reported; -- = Not Applicable; NA = Not Available; W = Withheld to avoid disclosure of individual company data. |
| Release Date: 3/29/2024 |
| Next Release Date: 8/30/2024 |