|
Download Data (XLS File) |
|
||||||||
|
||||||||
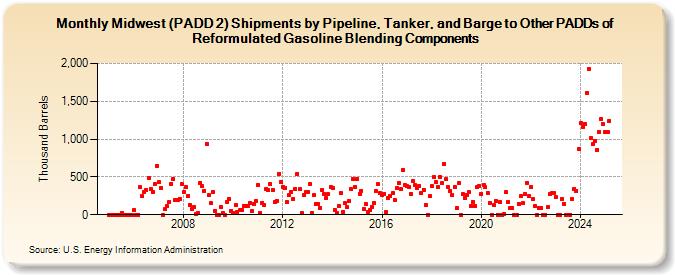
| Midwest (PADD 2) Shipments by Pipeline, Tanker, and Barge to Other PADDs of Reformulated Gasoline Blending Components (Thousand Barrels) | ||||||||
| Year | Jan | Feb | Mar | Apr | May | Jun | Jul | Aug | Sep | Oct | Nov | Dec |
|---|---|---|---|---|---|---|---|---|---|---|---|---|
| 2005 | 0 | 0 | 0 | 0 | 0 | 0 | 24 | 0 | 0 | 0 | 0 | 0 |
| 2006 | 61 | 0 | 0 | 363 | 241 | 294 | 330 | 482 | 342 | 306 | 405 | 650 |
| 2007 | 432 | 355 | 0 | 71 | 110 | 169 | 411 | 471 | 190 | 193 | 211 | 409 |
| 2008 | 301 | 366 | 254 | 127 | 73 | 99 | 16 | 28 | 420 | 374 | 320 | 941 |
| 2009 | 257 | 153 | 306 | 50 | 0 | 0 | 104 | 24 | 0 | 165 | 210 | 50 |
| 2010 | 25 | 126 | 34 | 58 | 57 | 117 | 116 | 117 | 160 | 49 | 146 | 187 |
| 2011 | 396 | 25 | 161 | 132 | 342 | 325 | 405 | 329 | 171 | 185 | 541 | 433 |
| 2012 | 369 | 353 | 166 | 264 | 306 | 209 | 342 | 542 | 335 | 25 | 256 | 300 |
| 2013 | 302 | 400 | 25 | 259 | 146 | 145 | 93 | 331 | 274 | 218 | 272 | 368 |
| 2014 | 353 | 65 | 25 | 118 | 282 | 38 | 151 | 101 | 184 | 334 | 477 | 368 |
| 2015 | 470 | 277 | 320 | 77 | 142 | 38 | 58 | 104 | 157 | 308 | 406 | 281 |
| 2016 | 259 | 279 | 37 | 220 | 245 | 285 | 195 | 354 | 421 | 340 | 592 | 390 |
| 2017 | 376 | 364 | 273 | 441 | 391 | 354 | 377 | 285 | 331 | 127 | 0 | 246 |
| 2018 | 375 | 496 | 427 | 370 | 501 | 413 | 672 | 467 | 368 | 311 | 258 | 370 |
| 2019 | 92 | 414 | 0 | 270 | 226 | 266 | 298 | 120 | 171 | 115 | 363 | 381 |
| 2020 | 280 | 389 | 363 | 291 | 160 | 0 | 129 | 187 | 0 | 165 | 0 | 15 |
| 2021 | 294 | 165 | 85 | 86 | 0 | 0 | 143 | 242 | 153 | 268 | 424 | 243 |
| 2022 | 370 | 206 | 113 | 0 | 93 | 95 | 0 | 0 | 98 | 273 | 282 | 285 |
| 2023 | 231 | 0 | 0 | 210 | 144 | 0 | 0 | 0 | 203 | 342 | 320 | 865 |
| 2024 | 1,210 | |||||||||||
| - = No Data Reported; -- = Not Applicable; NA = Not Available; W = Withheld to avoid disclosure of individual company data. |
| Release Date: 3/29/2024 |
| Next Release Date: 4/30/2024 |
Referring Pages: