|
Download Data (XLS File) |
|
||||||||
|
||||||||
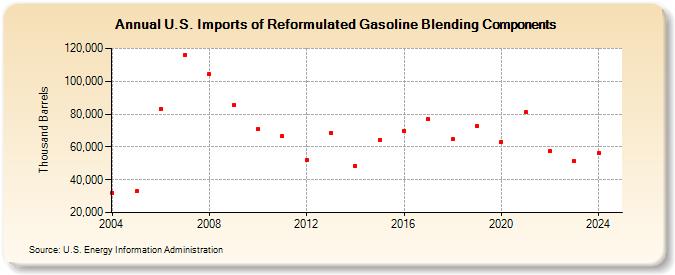
| U.S. Imports of Reformulated Gasoline Blending Components (Thousand Barrels) | ||||||||
| Decade | Year-0 | Year-1 | Year-2 | Year-3 | Year-4 | Year-5 | Year-6 | Year-7 | Year-8 | Year-9 |
|---|---|---|---|---|---|---|---|---|---|---|
| 2000's | 32,145 | 32,944 | 83,124 | 116,097 | 104,208 | 85,416 | ||||
| 2010's | 70,804 | 66,448 | 52,081 | 68,632 | 48,214 | 64,244 | 69,842 | 76,948 | 64,620 | 72,493 |
| 2020's | 63,274 | 80,998 | 57,590 | 51,342 |
| - = No Data Reported; -- = Not Applicable; NA = Not Available; W = Withheld to avoid disclosure of individual company data. |
| Release Date: 3/29/2024 |
| Next Release Date: 8/30/2024 |