|
Download Data (XLS File) |
|
||||||||
|
||||||||
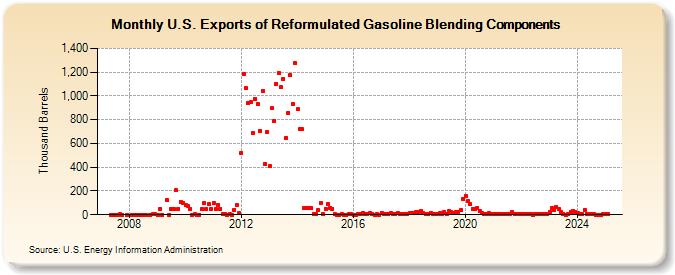
| U.S. Exports of Reformulated Gasoline Blending Components (Thousand Barrels) | ||||||||
| Year | Jan | Feb | Mar | Apr | May | Jun | Jul | Aug | Sep | Oct | Nov | Dec |
|---|---|---|---|---|---|---|---|---|---|---|---|---|
| 2007 | 1 | 0 | 1 | 1 | 2 | 0 | 0 | |||||
| 2008 | 0 | 0 | 0 | 0 | 0 | 0 | 0 | 0 | 3 | 5 | ||
| 2009 | 0 | 50 | 0 | 124 | 0 | 50 | 49 | 204 | 49 | 109 | 99 | |
| 2010 | 78 | 75 | 50 | 0 | 2 | 0 | 1 | 50 | 99 | 50 | 93 | 50 |
| 2011 | 98 | 50 | 84 | 51 | 4 | 3 | 0 | 4 | 1 | 40 | 78 | 11 |
| 2012 | 521 | 1,183 | 1,063 | 940 | 945 | 685 | 976 | 935 | 708 | 1,044 | 429 | 696 |
| 2013 | 408 | 895 | 789 | 1,103 | 1,194 | 1,072 | 1,146 | 649 | 859 | 1,172 | 934 | 1,275 |
| 2014 | 887 | 720 | 719 | 58 | 53 | 53 | 53 | 2 | 3 | 39 | 101 | 3 |
| 2015 | 51 | 93 | 55 | 52 | 3 | 1 | 1 | 2 | 1 | 1 | 2 | 3 |
| 2016 | 1 | 1 | 4 | 2 | 16 | 3 | 2 | 14 | 2 | 1 | 2 | 1 |
| 2017 | 11 | 4 | 6 | 3 | 12 | 9 | 7 | 12 | 8 | 8 | 8 | 10 |
| 2018 | 11 | 13 | 14 | 20 | 22 | 31 | 12 | 10 | 8 | 15 | 8 | 7 |
| 2019 | 8 | 16 | 10 | 24 | 10 | 31 | 22 | 18 | 23 | 24 | 36 | 134 |
| 2020 | 160 | 115 | 87 | 49 | 46 | 59 | 28 | 16 | 8 | 4 | 12 | 4 |
| 2021 | 9 | 5 | 7 | 4 | 3 | 8 | 9 | 3 | 21 | 3 | 2 | 3 |
| 2022 | 3 | 3 | 3 | 3 | 7 | 1 | 4 | 2 | 3 | 4 | 3 | 2 |
| 2023 | 23 | 54 | 36 | 63 | 51 | 21 | 8 | 1 | 3 | 26 | 35 | 22 |
| 2024 | 11 | 2 | 2 | 40 | 10 | 2 | 6 | 2 | 0 | 0 | 0 | 2 |
| 2025 | 2 | 2 | 170 | 0 | ||||||||
| - = No Data Reported; -- = Not Applicable; NA = Not Available; W = Withheld to avoid disclosure of individual company data. |
| Release Date: 6/30/2025 |
| Next Release Date: 7/31/2025 |